Figure 10
Download original image
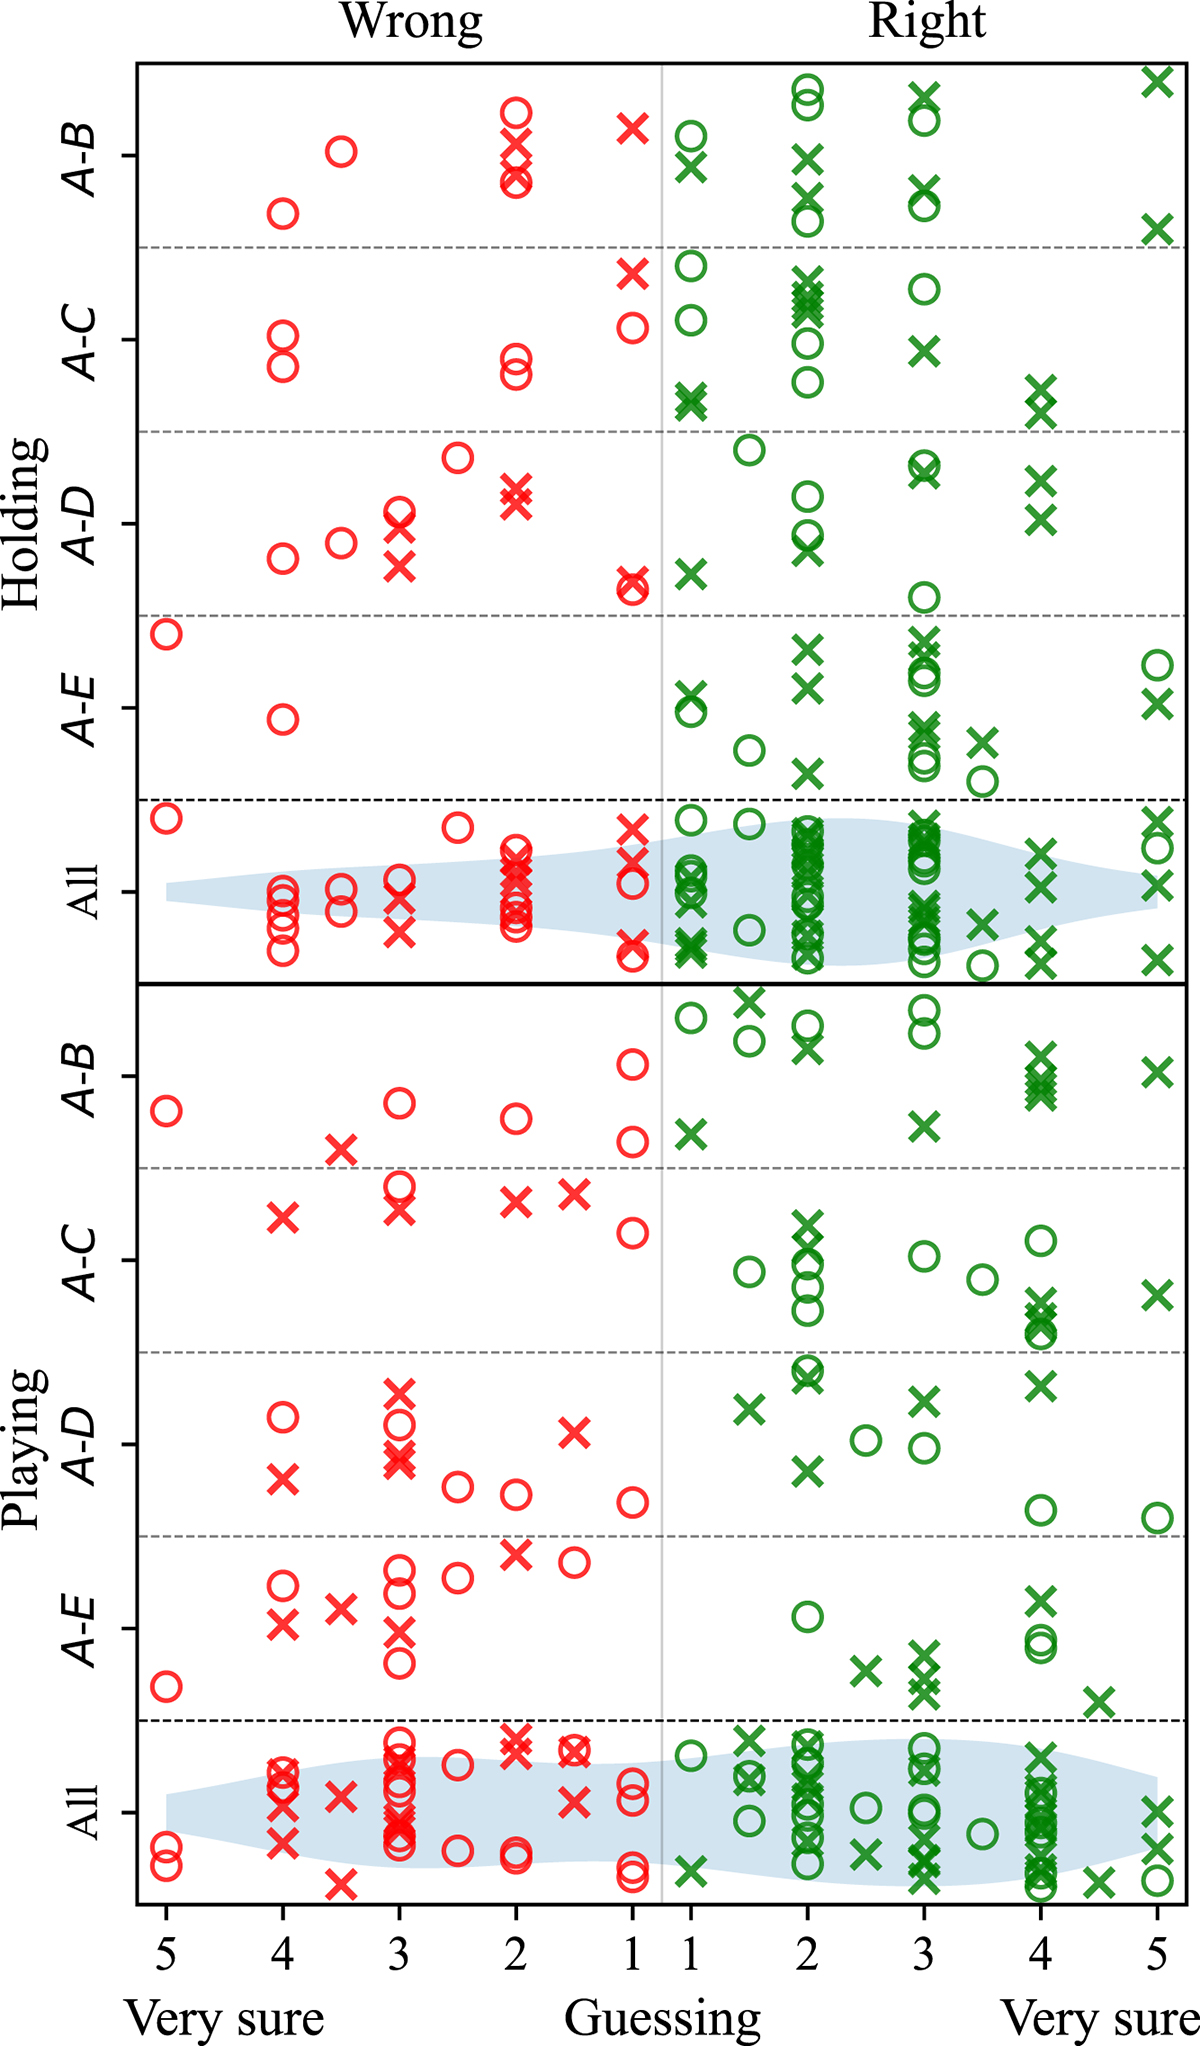
Distribution of responses for both holding and playing discrimination tests (Duo-Trio). The horizontal axis represents the two qualities of the responses: correctness, with incorrect responses shown in red on the left and correct responses in green on the right; and sureness, which ranges from 1 (not sure at all, guessing) to 5 (absolutely sure) in 0.5-point intervals. The marker type represents the real position of the reference bow A: circles when it was presented in first (holding test) or second (playing test) position, and crosses when it was presented last. There are N = 20 responses for each test and bow pair, corresponding to 20 participants. The distribution of responses for all bows, that is, the combination of all responses from each test regardless of the bow, is represented as a blue filling.
Current usage metrics show cumulative count of Article Views (full-text article views including HTML views, PDF and ePub downloads, according to the available data) and Abstracts Views on Vision4Press platform.
Data correspond to usage on the plateform after 2015. The current usage metrics is available 48-96 hours after online publication and is updated daily on week days.
Initial download of the metrics may take a while.