Open Access
Figure 3.
Download original image
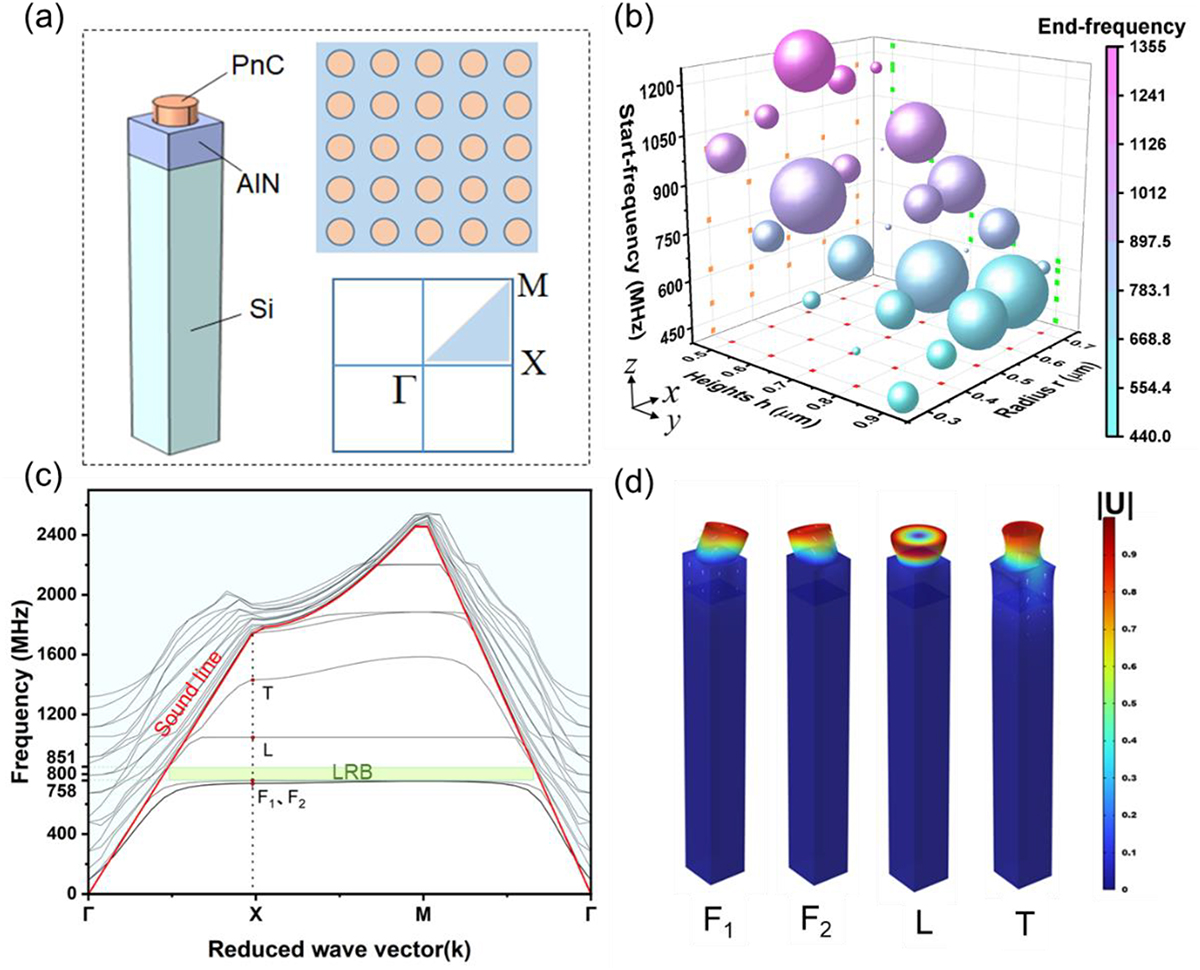
Energy band structure analysis. (a) Phononic crystals meta-cellular mode and the first irreducible Brillouin zone of PnCs. (b) Band gap variations at different radius and heights of the scatterer. (c) PnCs energy band structure diagram (r=0.5 μm, h=0.7 μm). (d) The displacement field of PnCs vibrational modes.
Current usage metrics show cumulative count of Article Views (full-text article views including HTML views, PDF and ePub downloads, according to the available data) and Abstracts Views on Vision4Press platform.
Data correspond to usage on the plateform after 2015. The current usage metrics is available 48-96 hours after online publication and is updated daily on week days.
Initial download of the metrics may take a while.