Figure 1
Download original image
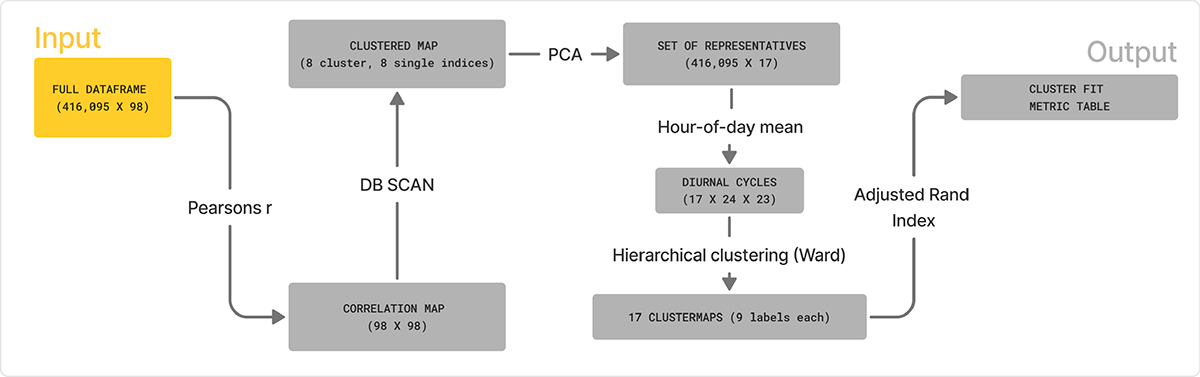
Methods used and outcome produced to address the research questions, the numbers in the brackets indicate the dimensions of the data structure, the first two steps we took in order to understand numerical overlap of the predefined set of indices, later we used PCA to select non-arbitrary indices as cluster representatives. This set of uncorrelated indices was then checked regarding sensitivity and response to the land use type where the device was positioned through a statistical procedure that included common clustering methods and the calculation of a validation metric.
Current usage metrics show cumulative count of Article Views (full-text article views including HTML views, PDF and ePub downloads, according to the available data) and Abstracts Views on Vision4Press platform.
Data correspond to usage on the plateform after 2015. The current usage metrics is available 48-96 hours after online publication and is updated daily on week days.
Initial download of the metrics may take a while.