Figure 3
Download original image
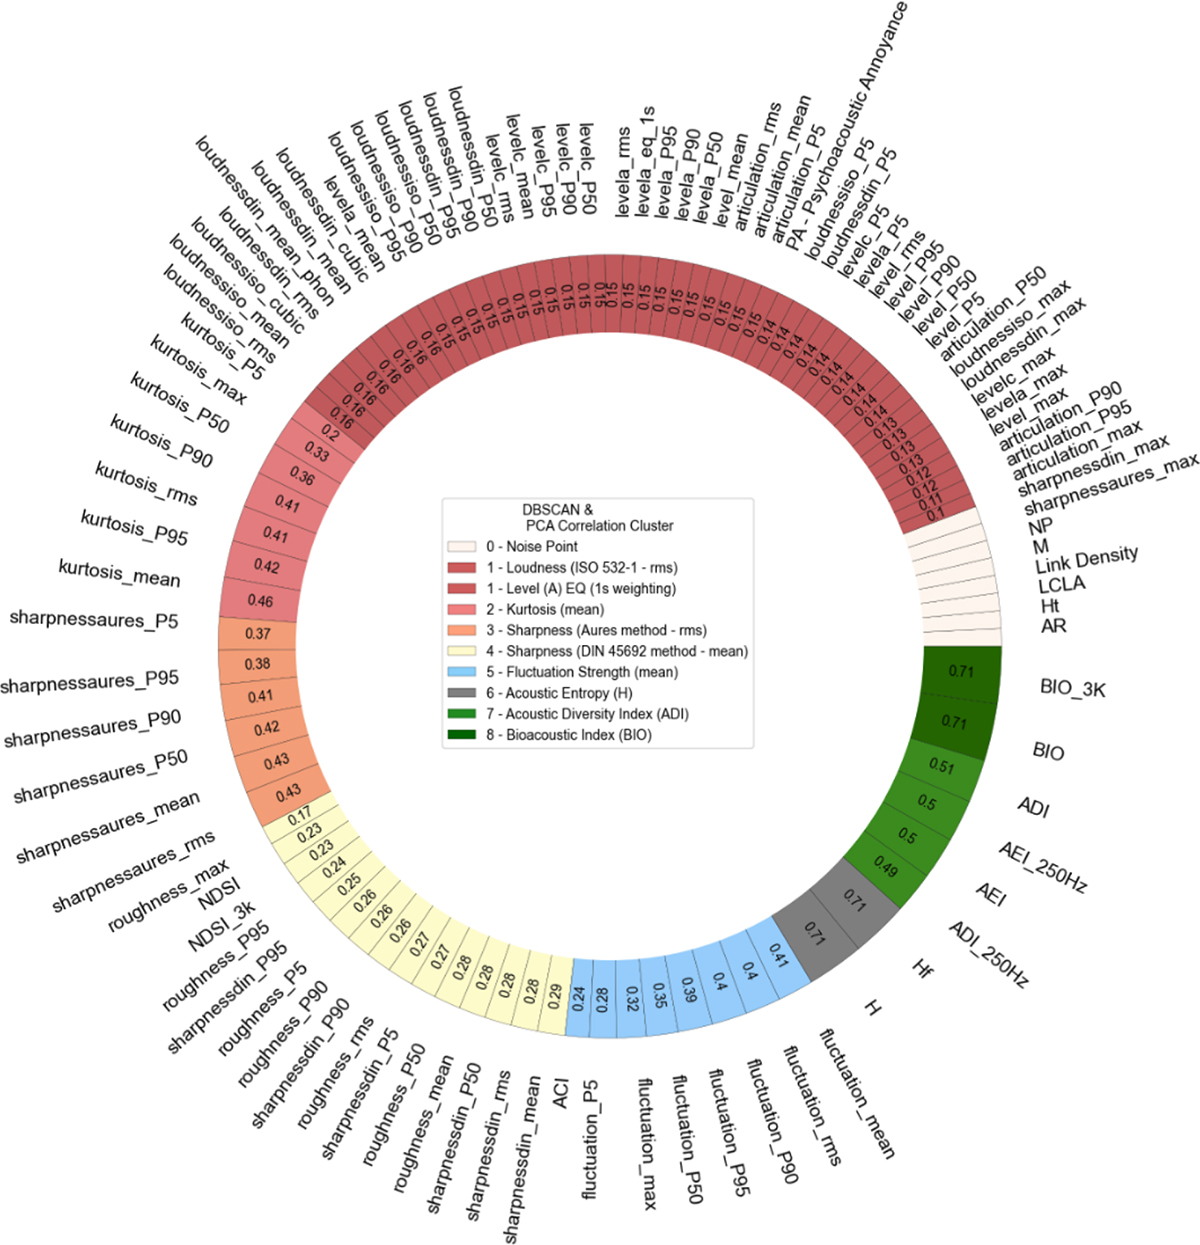
Clustering outcome after applying DBSCAN to a correlation matrix, resulting in eight distinct clusters of varying sizes indicated by their respective coloring, the numeric value added to each feature wedge represents the loading to the first principal component of the cluster that was subjected to principal component analysis (PCA). The feature-labels added to the legend were those being selected as key representatives of the respective cluster exposing the highest loading. Because of external validation reasons the A-rated sound pressure level was added to the list.
Current usage metrics show cumulative count of Article Views (full-text article views including HTML views, PDF and ePub downloads, according to the available data) and Abstracts Views on Vision4Press platform.
Data correspond to usage on the plateform after 2015. The current usage metrics is available 48-96 hours after online publication and is updated daily on week days.
Initial download of the metrics may take a while.