Open Access
Figure 1.
Download original image
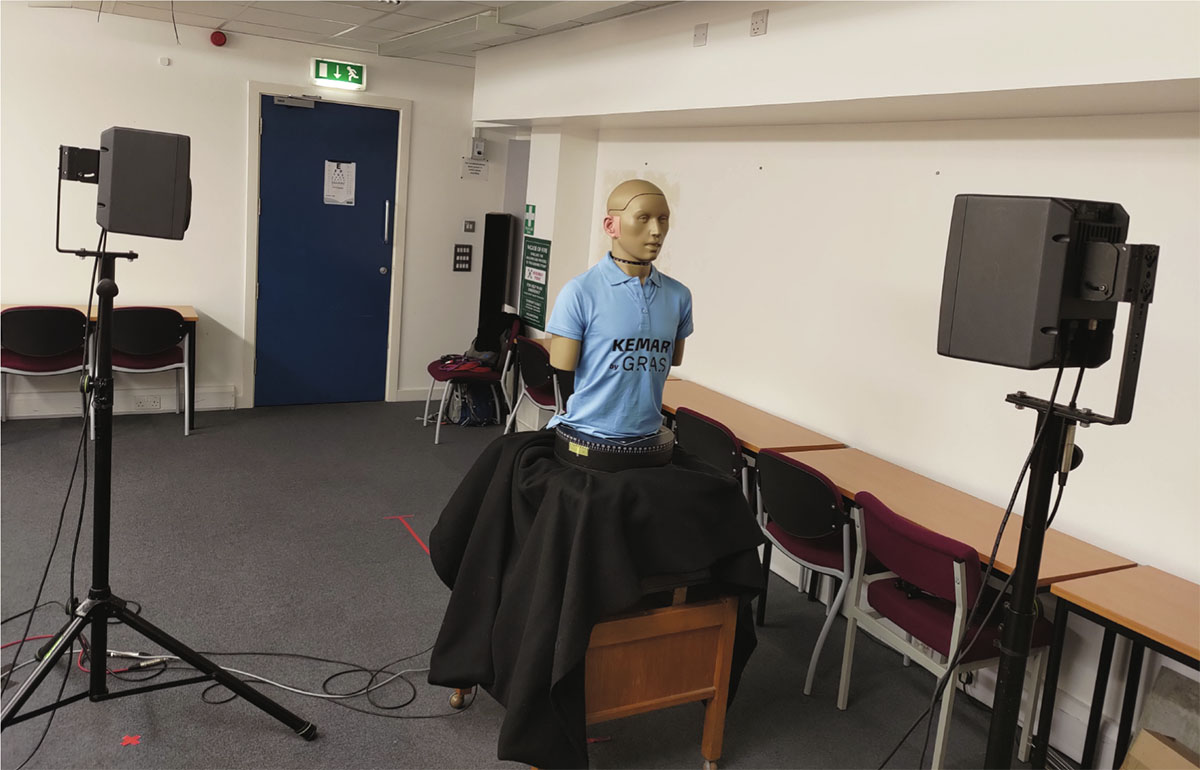
Illustration of the setup in the LTC seminar room at the University of Surrey, indicating all source and receiver positions used for the measurement. The rectangles depict the positions of tables, which were moved to the walls for the experiment. The black dots on the red line depict the nine measurement positions.
Current usage metrics show cumulative count of Article Views (full-text article views including HTML views, PDF and ePub downloads, according to the available data) and Abstracts Views on Vision4Press platform.
Data correspond to usage on the plateform after 2015. The current usage metrics is available 48-96 hours after online publication and is updated daily on week days.
Initial download of the metrics may take a while.