| Issue |
Acta Acust.
Volume 10, 2026
|
|
|---|---|---|
| Article Number | 16 | |
| Number of page(s) | 11 | |
| Section | Environmental Noise | |
| DOI | https://doi.org/10.1051/aacus/2026001 | |
| Published online | 11 March 2026 | |
Technical & Applied Article
Comparison between android applications and Class-I sound level meters in SPL measurement performance
National Institute of Science Education and Research, DAE, Khurda, Odisha 752050, India
* Corresponding author: This email address is being protected from spambots. You need JavaScript enabled to view it.
Received:
16
July
2025
Accepted:
6
January
2026
Abstract
Accurate measurement of sound pressure level (SPL) is a cornerstone for understanding acoustic communication, animal behavior, and ecological dynamics. Acoustic signals can be broadly categorized into broadband and tonal sounds. Broadband noise – spanning a wide frequency range – is useful for assessing general noise levels, while tonal sounds, defined by distinct harmonic frequencies, provide critical insight into subtle phenomena such as animal communication, echolocation, and specific patterns of noise pollution. Smartphone-based SPL measurement has emerged as an accessible and cost-effective alternative to conventional sound level meters (SLMs). However, previous evaluations of SPL applications have primarily relied on iOS platforms and broadband noise measurements, leaving a significant gap in understanding how these tools perform for tonal sound measurements on Android devices – the more widely used operating system. To address these limitations, our study evaluated top three freely available Android SPL applications – Bolden, Kewlsoft, and KTW – against a Brüel & Kjær Class I SLM. The assessment employed both white noise and tonal stimuli across frequencies representative of natural soundscapes, facilitating a comprehensive performance comparison. Among these, the Bolden Sound Level Meter consistently delivered the most accurate readings for tonal measurements, whereas KTW performed well for broadband noise measurement, demonstrating the potential of Android-based tools in advancing environmental monitoring and wildlife conservation initiatives.
Key words: Bolden application / Environmental acoustics / Sound Pressure Level (SPL) / Smartphones
These authors contributed equally to this work.
© The Author(s), Published by EDP Sciences, 2026
 This is an Open Access article distributed under the terms of the Creative Commons Attribution License (https://creativecommons.org/licenses/by/4.0), which permits unrestricted use, distribution, and reproduction in any medium, provided the original work is properly cited.
1 Introduction
Acoustic communication is a fascinating and intricate form of communication modality prevalent throughout the natural world, including human societies. It encompasses the transmission and reception of sound signals to convey information between individuals or groups. In nature, a significant proportion of animal communication is through the acoustic channel, prevailing over other sensory modalities [1]. Our ability to passively intercept the acoustic signals of animals allows us to collect critical information about their behaviour, life history and communities [2].
Acoustic signals transmit spectral, temporal, and intensity information. Intensity, expressed as sound pressure level (SPL), influences signal detectability and range. Tympanal membranes detect SPL through pressure fluctuations, determining auditory sensitivity. In humans, tympanal sensitivity ranges from 20 μPa to 200 Pa (a 107-fold span) and 20 Hz to 20 000 Hz (a 1000-fold span) [3]; many species exceed these limits [1]. Measuring SPL accurately requires instruments that are sensitive across this full pressure and frequency spectrum.
Hand-held sound level meters (SLM) (pioneered by Bruel & Kjaer) measure the SPL with high accuracy set by the American National Standards Institute (ANSI S1.4) (Class I SLM with ±1 dB accuracy, Class II SLMs with ±2 dB accuracy), International Electrotechnical Commission (IEC) [4]. To attain precise measurements, these SLMs use different options. The SLM can operate and be more sensitive at different frequency domains by using frequency weightings (A, C, Z) [5]. As SPL is an instantaneous measurement, different time weightings in SLMs allow a normalized SPL measurement over a fixed period of time. SLMs also use frequency analyzers to estimate SPL measurements at specific peak frequencies (especially useful for tonal sounds) [6]. However, such precision comes at a cost that can be prohibitive for universal usage. Also, though handheld, some of these devices are bulky and operate only on proprietary software.
SPL measuring applications in smartphones give us a potential alternative. Smartphones are quickly becoming as much a video, audio, and computation device as a communication device. Countless applications are available, freely and for purchase, which offer to act as recorders and analysers of sound signals. Few studies have examined the potential of phone applications and mobile phones to be used as SLMs.
Ibekwe et al. (2016) evaluated the Androidboy1 application in Android phones (Samsung Galaxy note 3; Nokia S; and Tecno Phantom Z) as a screening tool for environmental noise (varying loudness below 100 dB) monitoring [7]. Androidboy1 was found to have a high positive correlation (r = 0.9) and accuracy (±2 dB) with respect to SLM readings.
McLennon et al. (2019) conducted a study across 5 iPhones and 5 Android devices, with 5 iOS and 5 Android applications using white noise, pink noise, speech audio, and various occupational noises with varying loudness from 60 to 90 dB [8]. They found that only SLA Lite (iOS application) performed with good accuracy (±1 dB error) across all loudness levels, and suggest the same could be used as a noise screening tool. Android applications generally performed worse compared to iOS counterparts and especially underreported noise at > 90 dB. Overall, they noted that the applications’ accuracy was inconsistent across conditions and were not reliable for measurements.
Murphy et al. (2016), using white noise of 50, 70 and 90 dB loudness, tested 100 smartphones (including Android and iPhones) to conclude that iPhone applications in general have better accuracy than Android applications [9]. Among them, SPLnFFT remained the only application that maintained a ±2 dB difference with the SLM reference measurement across all noise conditions. They additionally observed that the age of the device had a significant effect on the accuracy, with older phones being less reliable. Fava et al. (2016) evaluated iPhones as SLMs in clinical settings using C-weighted values, mimicking the human auditory response curve [10]. Using tonal sounds (125 Hz to 8 kHz) ranging between 60 and 100 dB, they found that the mean difference from the SLM readings fell within the ±2 dB range in the case of frequencies < 4 kHz, but the standard deviation of these mean differences was too large for the limits of agreement to be within this range. Above the frequency of 4 kHz, the mean difference in SPL measurement fell outside the ±2 dB range.
Kardous and Shaw (2014), using pink noise (65–95 dB) played back from a loudspeaker, evaluated 10 iOS applications across four different iPhone models [11]. They concluded that certain iOS applications can be used as substitutes for class II SLMS with an error of ±2 dB. They used iPhone models 3GS, 4S and 5 for this study and found that the 3GS model was most consistent with the SLM. A follow-up study in 2016 showed that the applications performed better when paired with external calibrated microphones [12]. Studies have also shown that calibrated external microphones, when paired with a competent application performed with greater accuracy [13, 14].
Interestingly, most of these studies have made comparisons using white or pink noise, which has components across all frequencies, and did not examine the usefulness of these instruments across specific frequencies. SPL measurements of specific frequencies (tonal sounds) are crucial alongside white noise to identify specific frequencies that may cause discomfort, hearing damage, or affect concentration. From a bioacoustics perspective, several species use tonal signals to convey critical information, such as warnings or mating calls, making their accurate measurement essential for studying ecological interactions [15]. The only previous study at the time of our own investigation that tested across tonal sounds [10], reported higher errors in higher frequencies only in iOS applications. A very recent study by Khan et al. (2025) used tonal sounds ranging from 100 to 4000 Hz to examine the capabilities of Android applications, but from a bioacoustics perspective, this range covers very little of the spectrum of acoustic signals [16]. Moreover, none of the studies used calibration using an SLM, which can significantly improve the accuracy of the applications. Hence, it is important to examine the capability of newer SPL measuring applications across a broad spectrum of tonal frequencies and white noise, and a range of loudness, using the in-application calibration feature. This would provide insights into the usefulness of smartphones as SLMs. However, as in application calibration features do not follow strict guideline, they can be at best termed as pseudo-calibration. Hence, hereafter, whenever we used the in application calibration feature, we have termed it as pseudo-calibration.
The objective of this study is to compare the performance of different freely available SPL measurement applications, using two android phones, with a type I SLM to gauge their usefulness as SLMs. We chose Android applications as Android phones occupy ∼72% of the global market share of smartphones. We test this across a range of loudness (∼60–100 dB), frequencies (3 kHz–10 kHz) and noise types (tonal sounds and white noise), with and without in-application pseudo-calibration when available.
2 Material and methods
We compared the sound pressure level measurements in decibels (dB) of our applications of interest with those of the Sound Level Meter (SLM) for tonal and white noise sounds varying in loudness. We used a laptop (Hewlett-Packard model 14-ck2xxx) to generate and playback the tonal sounds ranging from 3 kHz to 10 kHz (3 kHz, 4 kHz, 5 kHz, 6 kHz, 7 kHz, 8 kHz, 9 kHz and 10 kHz) and the white noise. This range covered the most populated area of frequencies used by different organisms (insects, birds, and mammals) [1] as well as various anthropogenic noise profiles [17–21].
We generated the tonal sounds and white noise using the “Generate Tones” and “Generate White Noise” options in the Audacity software (version 3.2.1). We ensured that the generated sounds and their playback were of the correct frequencies by re-recording the playback and checking their frequencies. We used a JBL Clip4 Bluetooth speaker (dynamic frequency response range 100 Hz–20 kHz) for playback and a Zoom H2next recorder and Sennheiser MKE 600 Shotgun microphone HSN 8518 for recording. Analysis was done using Audacity software. We controlled the playback loudness using the volume key of the playback laptop. The audio was played continuously using a JBL Clip4 Bluetooth speaker in a sound proof box (55 cm × 55 cm × 60 cm) lined with acoustic foam of a thickness of 14 cm. 14 cm thickness allowed for the complete absorption of sound waves of frequency as low as 3 kHz since their corresponding wavelengths were shorter than 14 cm. We placed the speaker in one corner of the sound proof box and kept the sound level meter and the phones (with the relevant applications) at 20 cm from the source in line with the speaker diaphragm. We used Bruel & Kjaer Type 2250S Sound Level Meter and Analyzer (SLM) fitted with the default type 4189: pre-polarized Free-field 1/2′′ microphone for the measurement of the SPL in dB scale. The sound level meter was calibrated six months before the start of our study using Bruel & Kjaer Type 4231 sound calibrator. We used two Android phones, Phone 1, a Vivo Y91 (model 1811, purchased in May 2019), and Phone 2, a Poco X2 (Model M1912G7BI, purchased in July 2021), for measurements of SPL through the applications. We chose three applications,
-
Bolden Sound Level Meter v1.5.2 (User rating 4.0),
-
KTW Apps Sound Meter: SPL &dB meter v7.7 (User rating 4.5) and
-
Keuwlsoft SPL Meter v1.16 (User rating 4.0).
Bolden Sound Level Meter (v1.5.2) and KTW Applications’ Sound Meter: SPL & dB Meter (v7.7) were the best rated freely available applications on Google Play Store with respect to user ratings. Keuwlsoft SPL Meter v1.16 was chosen for testing because it offered a 3-point pseudo-calibration option, a unique pseudo-calibration method that can potentially give good precision. All application versions were the same across the two phones.
We started recording the SPL values from 15% of the volume level, as indicated in the laptop software, which corresponded to a loudness of 54.3 ± 1.1 dB at 3 kHz and 61.7 ± 1.2 dB for white noise (as measured by the SLM). The volume level was gradually increased to 100, as indicated on the laptop. We did not alter the volume button on the speaker.
2.1 Application description
The tested android applications and their features have been tabulated in Table 1. The specific details regarding each application are described below.
Android applications and their features tabulated.
2.1.1 Bolden sound level meter
Bolden application allows SPL measurement across octave or 1/3 octave bands; FFT window sizes (4096 or 8192); and fast/slow time weighting. It uniquely supports frequency-specific SPL measurement, making it the only application among those tested with this feature. SPL was recorded at various volume levels using Bruel & Kjaer (B&K) SLM, followed by two Android phones. We measured the SPL of the white noise playback at different volume levels using the B&K SLM (Z-frequency weighting) and the Bolden Sound Level Meter on two Android devices.
2.1.2 Keuwlsoft SPL meter
Keuwlsoft application supports spectrum displays in octave or 1/3 octave bands and three graph update speeds. It provides one-, two-, or three-point pseudo-calibration and a “REL” offset function for comparative SPL evaluation. Lacking frequency analysis, for this application, we relied on A-weighted broadband SPL readings. The white noise was measured as stated above in the case of the Bolden application.
2.1.3 KTW noise meter
KTW offers adjustable display refresh rates (0.4 s, 1 s, 2 s), which control the refresh rate of the SPL level displayed on the meter, pseudo-calibration options, and data saving with SPL statistics and time plots. It lacks frequency analysis, so only A-weighted broadband readings were used. The white noise was measured as stated above in the case of the Bolden application.
2.2 Application pseudo-calibration procedure
2.2.1 Bolden sound level meter
We pseudo-calibrated this application via its “Calibration” feature by adjusting the “Correction” line so that Application SPL + Correction = SLM SPL for a given playback level. We used Z-Frequency weighted, F time weighted (Instantaneous), frequency-specific EQ SPL measurement (measurement lasted 30 s or till EQ value stabilized, whichever is earlier) (frequency analyzer) in the Bruel & Kjaer SLM for the measurements. We used Z-frequency weighted, FAST Time Weighted frequency specific SPL measurement (using frequency analyzer) in the application. We chose matching frequency bands in the Bruel & Kjaer: 3.15 kHz for 3 kHz tonal sound, 4 kHz for 4 kHz tonal sound, 5 kHz for 5 kHz tonal sound, 6.3 kHz for 6 kHz tonal sound, 6.3 kHz for 7 kHz tonal sound, 8 kHz for 8 kHz tonal sound, 10 kHz for 9 kHz and 10 kHz tonal sounds. A-weighted SPL readings were additionally recorded for comparative purposes.
2.2.2 Keuwlsoft SPL meter
We pseudo-calibrated this application using the feature “CAL” by filling a measurement table with up to 3 volume levels. SPLs at volume levels 25, 40, and 50 were measured with B&K SLM (A-weighted) and input as “Actual” values, alongside app-measured values via the “Tap to Measure” feature. SPL readings were taken with and without pseudo-calibration on both phones.
2.2.3 KTW noise meter
Pseudo-calibration for KTW involved adjusting the application’s SPL reading via “+”/“–” buttons until matching the SLM value (e.g., +3 dB offset if the application shows 60 dB and SLM shows 63 dB). Pseudo-calibration used a 3kHz tone at a 35 dB volume level. A-weighted broadband measurements were collected using both SLM and phones.
2.3 Statistical analysis
2.3.1 Comparison of the applications in measuring the sound pressure level of tonal sounds
We compared sound pressure level measurements from the three mobile applications (Bolden, KTW Noise Meter, and Keuwlsoft) against SPL values from the SLM. We used measurements for tonal sounds at 3, 6, and 10 kHz to compare the three applications. The absolute differences between application measurements and SLM values (in decibels) exhibited non-normality (Shapiro–Wilk test). To address this, we used Box-Cox transformations with a lambda value of 0.03. We then analyzed the transformed data using generalized linear models (GLMs), incorporating application type, frequency, device ID, pseudo-calibration status, and SLM values as predictor variables.
2.3.2 Comparing Bolden and KTW across a continuous range of frequencies
We compared sound pressure level measurements from the mobile applications Bolden and KTW Noise Meter against SPL values from the SLM meter. We used measurements for tonal sounds at 3, 4, 5, 6, 7, 8, 9 and 10 kHz to compare the applications, which showed more consistency and accuracy as compared to Keuwlsoft. The data was Box-Cox transformed (owing to non-normality, lambda value 0.38). We fitted a GLM incorporating application type, frequency, device ID, pseudo-calibration status, and SLM values as predictor variables.
2.3.3 Testing the frequency analyzer feature in the Bolden application
We compared sound pressure level measurements from the mobile application Bolden against SPL values from the SLM meter when the frequency analyzer feature was used and when it was not used. We used measurements for tonal sounds at 3, 4, 5, 6, 7, 8, 9 and 10 kHz to test for the accuracy and consistency of the frequency analyzer feature. We fitted a GLM incorporating frequency, device ID, pseudo-calibration status, and SLM values as predictor variables, in addition to using the Frequency analyzer feature.
2.3.4 Comparison of the applications in measuring the sound pressure level of white noise
We compared sound pressure level measurements from the three mobile applications (Bolden, KTW Noise Meter, and Keuwlsoft) against SPL values from the SLM meter. We used measurements for white noise to compare them. The data was Box-Cox transformed (owing to non-normality, lambda value 0.18). We then analyzed the transformed data using generalized linear models (GLMs) incorporating application type, device ID, pseudo-calibration status, and SLM values as predictor variables.
3 Results
In all results sections, we define the accuracy of an application as “trueness” – the closeness of agreement between the average measurement and the reference value – relative to the Class I SLM value, in accordance with ISO 5725-1:2023.
3.1 Comparison across tonal sounds
In this analysis, the data were transformed, and hence, the estimates are in the transformed scale rather than in the dB scale (range −4.3 to +9.2, where −4.3 is most accurate).
We found that the SPL measured by the Bolden application was the most consistent and accurate across different frequencies and loudness (Figs. 1A and 1B, Tab. 2). Here, and henceforth by “consistent” and “inconsistent” we refer to the behavior of the trueness scores (ISO 5725-1:2023(en)). The accuracy of the application was significantly higher while measuring low-amplitude tonal sound (Figs. 1A and 1B, Tab. 2). The application performed consistently across the range of frequencies in device 2 (a newer Android device), irrespective of the loudness of the sound (Figs. 1A and 1B, Tab. 2). In device 1 (the older Android device), the accuracy declined marginally with increasing frequency, irrespective of the loudness of the tonal sound (Figs. 1A and 1B, Tab. 2).
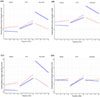 |
Figure 1. Predicted (using the statistical model) difference between SLM (Sound Level Meter) and application measurements with increasing frequency for three applications: Bolden, KTW, and Keuwlsoft. Dashed lines represent Device 1, and solid lines represent Device 2 for each application. (A) Differences for a sound level of 54.4 dB. (B) Differences for a sound level of 106.9 dB. (C) Differences for pseudo-calibrated applications. (D) Differences without pseudo-calibration. |
Summary of generalized linear model results assessing the effects of application type (KTW, Keuwlsoft and Bolden), sound pressure level (Loudness), device ID, frequency, and pseudo-calibration status on SPL measurement differences from a standard SLM meter.
The KTW application was the 2nd most consistent and accurate application among the three applications. The application was more accurate while measuring low-amplitude tonal sounds at lower frequencies, and the accuracy decreased with increasing frequency and loudness (Figs. 1A and 1B, Tab. 2). The accuracy of the application was comparable across the devices (Figs. 1A and 1B, Tab. 2).
The Keuwlsoft application was the most inconsistent and inaccurate application among the three applications tested. The application was more accurate in device 1, whereas in device 2, it was extremely inaccurate, often giving spurious results such as −1370 dB and −950 dB for corresponding SPL measurements of 98.8 dB and 62 dB, respectively (Figs. 1A and 1B, Tab. 2). In device 1, while measuring tonal sounds, irrespective of sound loudness, the application exhibited higher accuracy at high frequencies; however, at lower frequencies, it became significantly inaccurate (Figs. 1A and 1B, Tab. 2).
We found that without pseudo-calibration, Bolden and Keuwlsoft applications measured the sound pressure level with comparable accuracy (Fig. 1D, Tab. 2) across the devices (older and newer Android devices). The non pseudo-calibrated KTW application was most accurate while measuring lower-frequency sounds; however, its accuracy decreased significantly with increasing frequency. When we pseudo-calibrated the applications using the actual measurements made by the SLM, the effect was most significant in the Bolden application, which showed significantly better accuracy (Fig. 1C). The accuracy was significantly greater in device 2, the newer Android phone (Fig. 1B). Post pseudo-calibration, the KTW application became more consistent across frequency in both devices, but its accuracy decreased with increasing frequency (Fig. 1C). Post pseudo-calibration, the Keuwlsoft application became more accurate in device 1, only at a higher frequency, but in device 2, it was highly inaccurate, making it an unreliable application.
These results showed that the Keuwlsoft application was the least consistent with regard to SPL measurement accuracy among the three applications, and Bolden was the best, both with regard to consistency and accuracy.
3.2 Comparison with white noise
While measuring the loudness of white noise in device 2 (a newer Android device), the applications exhibited comparable accuracy that decreased with increasing loudness (Fig. 2, Tab. 3). In device 1 (an older Android device), the applications showed comparable accuracy while measuring white noise loudness at lower amplitudes. However, the Bolden and Keuwlsoft applications became significantly worse with increasing loudness. Interestingly, the KTW application, while measuring the loudness of white noise in device 1, became more accurate with increasing loudness. These results suggested that for measuring white noise loudness, the KTW application was better and more consistent across devices (Fig. 2, Tab. 3), and the applications were indistinguishable in the newer device.
 |
Figure 2. Predicted (using the statistical model) difference between SLM (Sound Level Meter) and application measurements while measuring white noise with change in loudness across the three applications: Bolden, KTW, and Keuwlsoft. Dashed lines represent Device 1, and solid lines represent Device 2 for each application. |
Summary of a GLM assessing the effects loudness, application type, and device ID on differences in SPL measurements from a standard SLM for measuring the loudness of white noise.
3.3 Comparison across the 3–10 kHz frequency range
As the previous experiment was only across three discrete tonal frequencies, we compared the performance of the Bolden and the KTW applications across a finer range of frequencies, ranging from 3 to 10 kHz. In this analysis, the data were transformed, and hence, the estimates are in the transformed scale rather than in the dB scale (range −2.2 to +11, where −2.2 is most accurate). We found that the SPL level measured by the Bolden application was more accurate and consistent in comparison to the KTW application.
While measuring low-amplitude tonal sounds at lower frequencies, the Bolden application exhibited the highest accuracy (Fig. 3A, Tab. 4). This pattern was true across the devices (Fig. 3A). However, at higher frequencies, the accuracy of the application decreased significantly (Fig. 3A), especially in device 1. The KTW application’s accuracy was significantly poorer in comparison to the Bolden application. In device 2, the accuracy did not vary with a change in the frequency of the tonal sound; however, in device 1 (older Android device), the accuracy declined with an increase in frequency (Fig. 3A, Tab. 4).
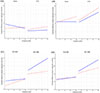 |
Figure 3. Predicted (using the statistical model) difference between SLM (Sound Level Meter) and application measurements with increasing frequency for two applications: Bolden and KTW. Dashed lines represent Device 1, and solid lines represent Device 2 for each application. (A) Differences for a sound level of 50.9 dB. (B) Differences for a sound level of 107.4 dB. (C) Differences for pseudo-calibrated devices (D) Differences for devices without pseudo-calibration. |
Summary of GLM results assessing the effects of frequency, device ID, pseudo-calibration status, loudness, and application type on differences in SPL measurements from a standard SLM in the applications Bolden and KTW.
While measuring high-amplitude tonal sounds, both the Bolden and KTW applications were less accurate in comparison to their respective accuracy at lower amplitudes (Figs. 3A and 3B). However, the Bolden application was significantly more accurate than the KTW application while measuring lower-frequency sounds, irrespective of the device tested (Fig. 3B, Tab. 4). Importantly, in device 2, while measuring high-amplitude and high-frequency tonal sounds, the Bolden application became more accurate (Fig. 3B, Tab. 4). While measuring high amplitude tonal sounds, the KTW application was significantly less accurate than the Bolden application, and the accuracy decreased significantly with increasing frequency in both devices, being significantly less accurate in device 1 (Fig. 3B, Tab. 4).
We found that without pseudo-calibration, while measuring low-amplitude tonal sounds, both Bolden and KTW applications showed comparable accuracy, which decreased marginally with increasing frequency (Fig. 3D, Tab. 4). When pseudo-calibrated, the Bolden application became significantly more accurate while measuring lower-frequency, low-amplitude tonal sounds (Fig. 3C, Tab. 4). Pseudo-calibration led to a marginal increase in accuracy while measuring low-amplitude tonal sounds in the KTW application, which did not alter with frequency (Fig. 3C).
While measuring high-amplitude tonal sounds, we found that both applications became less accurate (Figs. 3C and 3D, Tab. 4). However, the Bolden application was significantly more accurate than the KTW application across all the frequencies, irrespective of pseudo-calibration (Fig. 3D, Tab. 4). The Bolden applications measurement was also more consistent across the frequencies tested, especially when pseudo-calibrated (shallower slope) (Fig. 3D, Tab. 4).
These results clearly showed that, while measuring tonal sounds, the Bolden application was significantly better than the KTW application and closest to replicating the SPL measurements of a class I SLM.
3.4 Effect of frequency analyzer feature in Bolden application
We further tested the performance of just the Bolden application against the SLM by altering an additional feature in the application, the frequency analyzer. This feature allows frequency specific amplitude measurement rather than using the broad A and C filter. In this analysis, the data was not transformed, and hence, the estimates are in comparison to the actual SLM measurements in the dB scale (range −40 dB to +10 dB, 0 being most accurate).
The frequency analyzer had a marginal impact on the accuracy of the Bolden application (Tab. 5, Supplementary Figure 1), making the application more accurate irrespective of the amplitude and frequency of the sound. While measuring loudness, the Bolden application was most accurate on device 2 (a newer Android device), across all loudness and across different frequencies (Fig. 4B, Tab. 5). The accuracy was significantly high while measuring higher frequency. In device 1, while measuring the loudness of low-amplitude tonal sound, the application was more accurate (Fig. 4A, Tab. 5). However, this pattern reversed while measuring high-amplitude tonal sounds (Fig. 4A, Tab. 5). Pseudo-calibration improved the accuracy in both devices, with a stronger impact on device 2 (a newer Android device) (Figs. 4C and 4D, Tab. 5).
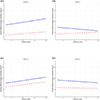 |
Figure 4. Predicted (using the statistical model) difference between SLM (Sound Level Meter) and application measurements with change in frequency for the Bolden Application. For panel A and B, dashed lines represent a sound level of 49.5 dB, and solid lines represent a sound level of 107.4 dB. (A) Differences for Device 1. (B) Differences for a Device 2. For panel C and D, dashed lines represent pseudo-calibrated devices and solid lines represent non pseudo-calibrated devices. (C) Differences for Device 1. (D) Differences for a Device 2. |
Summary of a GLM assessing the effects of frequency, loudness, pseudo-calibration status, device ID, and the use of the Frequency Analyzer feature on differences in SPL measurements from a standard SLM in the Bolden application.
4 Discussion
This study aimed to evaluate the reliability of sound pressure level (SPL) measurements obtained from Android-based applications in comparison to class-I sound level meters (SLMs) across a wide range of frequencies and loudness levels. Given the widespread accessibility and affordability of smartphone applications relative to standard SLMs, our goal was to assess their potential as practical alternatives for sound measurement. Our study evaluated the accuracy of three mobile sound measurement applications (Bolden, KTW Noise Meter, and Keuwlsoft) against a Class I SLM by comparing their performance across white noise (broadband sound) and various tonal frequencies, amplitudes, and different generations of Android devices. We also scrutinized the inbuilt features – loudness, pseudo-calibration, and frequency analyzer – within each application, finding that Bolden was the most consistent and accurate for tonal sounds, while Keuwlsoft displayed the least consistency and accuracy. We found that the Bolden application’s performance approached that of a Class I SLM, with the most accurate measurements falling within 0–5 dB of the SLM readings. We also found that pseudo-calibrating the applications with SLM values enhanced the accuracy of both Bolden and KTW; in contrast, Keuwlsoft’s improvement was negligible and inconsistent across devices. We found that measurements taken with the newer device were generally more accurate, particularly at higher frequencies. For white noise loudness measurements, the KTW application emerged as the most accurate and consistent across devices.
We found that the Bolden’s Sound Level Meter Application is the best in terms of replicating the SLM measurements, with an average departure of 13.2 ± 8.0 dB. The Bolden application performed consistently even at higher frequencies and louder tonal sounds. The frequency analyzer feature of this application improved the accuracy of measurements across different frequencies and loudness. Pseudo-calibration also improved accuracy with an average departure of 6.5 ± 6.7 dB, with a more pronounced impact in the newer device, where the average departure being 3.4 ± 4.0 dB. Measurements taken in the newer device were more accurate across the board. In conditions where Class I SLMs are not readily available, using the Bolden application on a newer Android device with the frequency analyzer feature can be a reliable alternative, even if the application is not pseudo-calibrated.
The KTW application was the second-best performer, with an average departure from SLM values of 23.4 ± 19.7 dB, and had some limitations. The KTW application was less accurate at higher frequencies and louder volume levels, even with pseudo-calibration. This suggests that there are problems with the application’s signal processing and makes it less reliable for higher frequency measurements. The KTW application also gave more accurate results on the newer device, with an average departure of 21.0 ± 18.4 dB. When measuring the loudness of white noise, while all applications performed with reasonable accuracy in the newer device, KTW was the most accurate across both the devices, with an average departure of 2.9 ± 2.9 dB from SLM measurement values. This could indicate that the KTW application is better suited to measuring broadband noise.
The Keuwlsoft application proved unsuitable for scientific or general use, producing erratic readings. Even after pseudo-calibration, it remained inconsistent, particularly in the older device. The better performance of the newer Android device indicated that hardware quality could influence measurement accuracy. However, this also indicates that performance may vary substantially across different smartphones. This indicates that the Keuwlsoft application is not tailored for rigorous, precise and consistent acoustic measurements, hence is best avoided for such use.
5 Conclusion
Previous studies have demonstrated that iOS applications can effectively substitute for dedicated sound level meters (SLMs) [10, 11], whereas Android applications have been shown to be less accurate (Murphy and King 2016). In general, smartphone applications tend to struggle in reliably replicating SLM measurements at higher sound levels [8]. Our findings indicate that the Bolden application can serve as a dependable application for loudness measurements when pseudo-calibrated on newer devices and for lower frequencies, though this reliability is currently limited to tonal signals; for white noise measurements, no mobile application has yet achieved the precision of dedicated SLMs, largely due to the heavy dependence on hardware quality. Dedicated SLMs are engineered with high-quality sensors, stringent calibration protocols, and minimal variability across devices – advantages that are challenging to replicate in smartphones, which are not primarily designed for precise acoustic measurement. Nonetheless, given their widespread availability, affordability, and ease of deployment, smartphones offer a promising baseline for loudness measurement in resource-limited conditions, with further improvements achievable through the development of robust pseudo-calibration algorithms that align smartphone outputs with reference SLM values. While our results offer significant insights, this study is subject to specific limitations. First, data collection relied on two Android smartphones; consequently, observed variations may stem from inherent differences in the sensitivity of their integrated microphones. Second, while the tested intensity range (60–100 dB) captures moderate to high environmental noise and the majority of bioacoustic signals, it excludes quiet environments (< 60 dB) and extreme industrial noise levels (> 100 dB). Crucially, however, 60−100 dB range encompasses the 85 dBA threshold for hazardous occupational noise exposure established by NIOSH [22]. Finally, our spectral analysis was restricted to the 3–10 kHz band. The 3–10 kHz range presents notable limitations: anthropogenic sounds, including vehicular and industrial noise, typically occur below 3 kHz, whereas diverse organisms communicate across frequencies both lower and higher than this band. However, our focus is clinically and ecologically justified: the 3–6 kHz range is recognized as the most vulnerable frequency for human noise-induced hearing loss (the “acoustic notch”) [23, 24], while the 3–10 kHz band constitutes the primary “acoustic niche” for biological signalling [25]. Thus, noise intrusion within this specific bandwidth poses a dual risk to human health and bioacoustic communication.
Acknowledgments
We thank Meera Rajagopal and Daniya C, NISER, for aiding in the initial pilot stages of this experiment.
Funding
We acknowledge SERB SRG/2021/001604 for the generous funding provided to RD that made this research possible. We acknowledge NISER, DAE for the start-up research grant that was crucial for this research. We thank DST for the INSPIRE-SHE fellowship that supported SS, ND and CLS.
Conflicts of interest
Authors declare no competing interests.
Data availability statement
The research data associated with this article are included in the supplementary material of this article.
Author contribution statement
Shwetha Sasindran – Investigation, formal analysis, data curation, visualization, writing, review and editing. N. DevAnand – Investigation, writing, data curation, review and editing. C.L. Srinivas – Investigation, writing, data curation, review and editing. Rittik Deb – Conceptualization, formal analysis, funding acquisition, resources, supervision, writing, review and editing.
Supplementary material
SUPPLEMENTARY TABLE 1. Example of calibration table provided by the Keuwlsoft. FIG. S. I. Predicted difference between SLM (Sound Level Meter) and application measurements for Device 1 and Device 2 in the Bolden Application with change in (A) Loudness and (B) Frequency. Differences are shown for measurements taken with the Frequency Analyzer mode (in solid lines) and without (in dashed lines). DATA TABLE I. Raw data for all SPL measurements. Access Supplementary Material
References
- J.W. Bradbury, S.L. Vehrencamp: Principles of Animal Communication. Vol. 132. Sinauer Associates, Sunderland, MA, 1998. [Google Scholar]
- S.L. McFadden, A.M. Simmons, C. Erbe, J.A. Thomas: Behavioral and physiological audiometric methods for animals, in: Exploring Animal Behavior Through Sound. Vol. 1. Springer International Publishing, Cham, 2022, pp. 355–387. https://doi.org/10.1007/978-3-030-97540-1_10. [Google Scholar]
- L. Caminos, J. Garcia-Manrique, A. Lima-Rodriguez, A. Gonzalez-Herrera: Analysis of the mechanical properties of the human tympanic membrane and its influence on the dynamic behaviour of the human hearing system. Applied Bionics and Biomechanics 2018 (2018) 1–12. [Google Scholar]
- International Standard: Electroacoustics – Sound Level Meters. Part 3: Periodic Tests: Edition 2.0. IEC Publications, Geneva, 2013. [Google Scholar]
- IEC: 61672-1, Electroacoustics – Sound level meters – Part 1: Specifications. International Electrotechnical Commission, Geneva, 2013. [Google Scholar]
- Brüel & Kjær: Microphone Handbook: Vol. 1 – Theory (Product Data Sheet BP0029). https://www.bksv.com/-/media/literature/Product-Data/bp0029.ashx, Last viewed April 29, 2025. [Google Scholar]
- T.S. Ibekwe, D.O. Folorunsho, E.A. Dahilo, I.O. Gbujie, M.M. Nwegbu, O.G. Nwaorgu: Evaluation of mobile smartphones App as a screening tool for environmental noise monitoring. Journal of Occupational and Environmental Hygiene 13, 2 (2016) D31–36. [Google Scholar]
- T. McLennon, S. Patel, A. Behar, M. Abdoli-Eramaki: Evaluation of smartphone sound level meter applications as a reliable tool for noise monitoring. Journal of Occupational and Environmental Hygiene 16, 9 (2019) 620–627. [Google Scholar]
- E. Murphy, E.A. King: Smartphone-based noise mapping: integrating sound level meter App data into the strategic noise mapping process. Science of The Total Environment 562 (2016) 852–859. [Google Scholar]
- G. Fava, G. Oliveira, M. Baglione, M. Pimpinella, J.B. Spitzer: The use of sound level meter apps in the clinical setting. American Journal of Speech-Language Pathology 25, 1 (2016) 14–28. [Google Scholar]
- C.A. Kardous, P.B. Shaw: Evaluation of smartphone sound measurement applications. The Journal of the Acoustical Society of America 135, 4 (2014) EL186–EL192. [Google Scholar]
- C.A. Kardous, P.B. Shaw: Evaluation of smartphone sound measurement applications (apps) using external microphones: a follow-up study. The Journal of the Acoustical Society of America 140, 4 (2016) EL327. [Google Scholar]
- B. Roberts, C. Kardous, R. Neitzel: Improving the accuracy of smart devices to measure noise exposure. Journal of Occupational and Environmental Hygiene 13, 11 (2016) 840–846. [Google Scholar]
- Y.C. Serpanos, J.R. Schoepflin, S.R. Cox, D. Davis: The accuracy of smartphone sound level meter applications (SLMAs) in measuring sound levels in clinical rooms. Journal of the American Academy of Audiology 32, 1 (2021) 27–34. [Google Scholar]
- H.C. Gerhardt: Auditory selectivity for the acoustic properties of conspecific mate-attracting signals in lower vertebrates and songbirds. Open Access Animal Physiology 7 (2015) 73–85. [Google Scholar]
- H. Khan, C. Findlay, R.A. Stevenson, T. Singh: Evaluating the accuracy of android applications in monitoring environmental noise levels. Cureus 17, 3 (2025) e81471. [Google Scholar]
- U. Sandberg: The multi-coincidence peak around 1000 Hz in tyre/road noise spectra. Euronoise Naples 89, 1–8 (2003) 2019. https://citeseerx.ist.psu.edu/document?repid=rep1 &type=pdf &doi=8bdaefd04198583dbe24c37f3f03f0145c4f5e84. [Google Scholar]
- J.R. Barber, K.R. Crooks, K.M. Fristrup: The costs of chronic noise exposure for terrestrial organisms. Trends in Ecology & Evolution 25, 3 (2010) 180–189. [Google Scholar]
- D. Pardo-Quiles, J.-V. Rodríguez, J.-M. Molina-García-Pardo, L. Juan-Llácer: Traffic noise mitigation using single and double barrier caps of different shapes for an extended frequency range. Applied Sciences 10, 17 (2020) 5746. [Google Scholar]
- E. Freitas, P. Pereira, L. de Picado-Santos, A. Santos: Traffic noise changes due to water on porous and dense asphalt surfaces. Road Materials and Pavement Design 10, 3 (2009) 587–607. [Google Scholar]
- V. Vaillancourt, H. Nélisse, C. Laroche, C. Giguére, J. Boutin, P. Laferriére: Comparison of sound propagation and perception of three types of backup alarms with regards to worker safety. Noise and Health 15, 67 (2013) 420–436. [CrossRef] [PubMed] [Google Scholar]
- H.S. Chan: Criteria for a Recommended Standard: Occupational Noise Exposure: Revised Criteria 1998, 1998. [Google Scholar]
- N. Natarajan, S. Batts, K.M. Stankovic: Noise-induced hearing loss. Journal of Clinical Medicine 12, 6 (2024) 2347. [Google Scholar]
- D.I. McBride, S. Williams: Audiometric notch as a sign of noise induced hearing loss. Occupational and Environmental Medicine 58, 1 (2001) 46–51. [Google Scholar]
- N. Howells, A.C. Lees, J. Barlow, E. Berenguer, L.C. Rossi, J. Sueur, M.J. Sullivan, Y.G. Ramos, O.C. Metcalf: Temporal patterns of Amazonian insect acoustic activity. Philosophical Transactions B 380 (1928) 20240337. [Google Scholar]
These authors contributed equally to this work.
Cite this article as: Sasindran S. Devanand N. Srinivas C.L. & Deb R. 2026. Comparison between android applications and Class-I sound level meters in SPL measurement performance. Acta Acustica, 10, 16. https://doi.org/10.1051/aacus/2026001.
All Tables
Summary of generalized linear model results assessing the effects of application type (KTW, Keuwlsoft and Bolden), sound pressure level (Loudness), device ID, frequency, and pseudo-calibration status on SPL measurement differences from a standard SLM meter.
Summary of a GLM assessing the effects loudness, application type, and device ID on differences in SPL measurements from a standard SLM for measuring the loudness of white noise.
Summary of GLM results assessing the effects of frequency, device ID, pseudo-calibration status, loudness, and application type on differences in SPL measurements from a standard SLM in the applications Bolden and KTW.
Summary of a GLM assessing the effects of frequency, loudness, pseudo-calibration status, device ID, and the use of the Frequency Analyzer feature on differences in SPL measurements from a standard SLM in the Bolden application.
All Figures
|
Figure 1. Predicted (using the statistical model) difference between SLM (Sound Level Meter) and application measurements with increasing frequency for three applications: Bolden, KTW, and Keuwlsoft. Dashed lines represent Device 1, and solid lines represent Device 2 for each application. (A) Differences for a sound level of 54.4 dB. (B) Differences for a sound level of 106.9 dB. (C) Differences for pseudo-calibrated applications. (D) Differences without pseudo-calibration. |
| In the text | |
|
Figure 2. Predicted (using the statistical model) difference between SLM (Sound Level Meter) and application measurements while measuring white noise with change in loudness across the three applications: Bolden, KTW, and Keuwlsoft. Dashed lines represent Device 1, and solid lines represent Device 2 for each application. |
| In the text | |
|
Figure 3. Predicted (using the statistical model) difference between SLM (Sound Level Meter) and application measurements with increasing frequency for two applications: Bolden and KTW. Dashed lines represent Device 1, and solid lines represent Device 2 for each application. (A) Differences for a sound level of 50.9 dB. (B) Differences for a sound level of 107.4 dB. (C) Differences for pseudo-calibrated devices (D) Differences for devices without pseudo-calibration. |
| In the text | |
|
Figure 4. Predicted (using the statistical model) difference between SLM (Sound Level Meter) and application measurements with change in frequency for the Bolden Application. For panel A and B, dashed lines represent a sound level of 49.5 dB, and solid lines represent a sound level of 107.4 dB. (A) Differences for Device 1. (B) Differences for a Device 2. For panel C and D, dashed lines represent pseudo-calibrated devices and solid lines represent non pseudo-calibrated devices. (C) Differences for Device 1. (D) Differences for a Device 2. |
| In the text | |
Current usage metrics show cumulative count of Article Views (full-text article views including HTML views, PDF and ePub downloads, according to the available data) and Abstracts Views on Vision4Press platform.
Data correspond to usage on the plateform after 2015. The current usage metrics is available 48-96 hours after online publication and is updated daily on week days.
Initial download of the metrics may take a while.