Figure 3.
Download original image
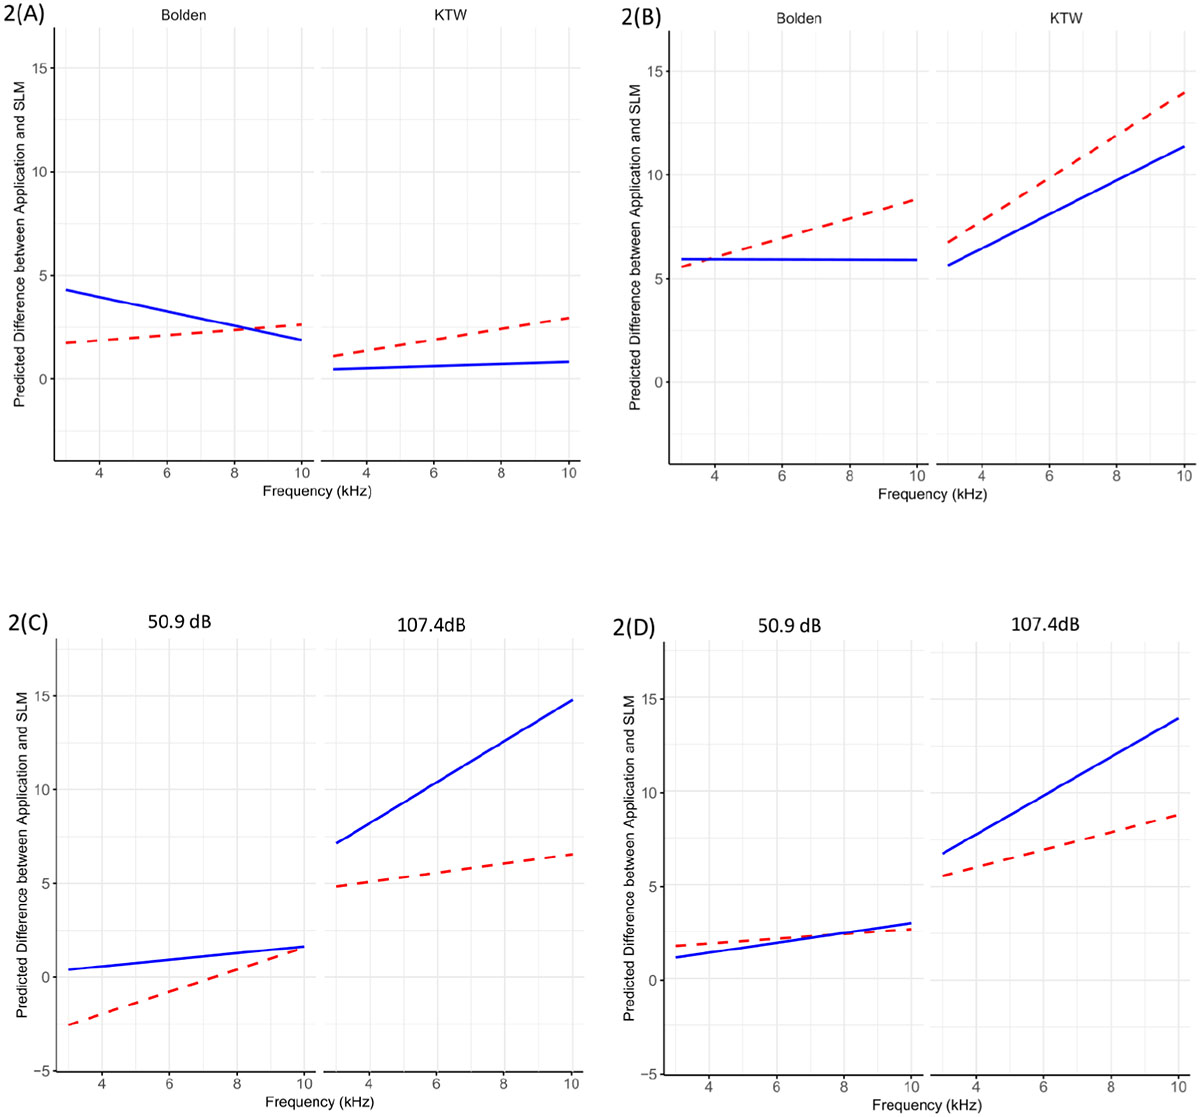
Predicted (using the statistical model) difference between SLM (Sound Level Meter) and application measurements with increasing frequency for two applications: Bolden and KTW. Dashed lines represent Device 1, and solid lines represent Device 2 for each application. (A) Differences for a sound level of 50.9 dB. (B) Differences for a sound level of 107.4 dB. (C) Differences for pseudo-calibrated devices (D) Differences for devices without pseudo-calibration.
Current usage metrics show cumulative count of Article Views (full-text article views including HTML views, PDF and ePub downloads, according to the available data) and Abstracts Views on Vision4Press platform.
Data correspond to usage on the plateform after 2015. The current usage metrics is available 48-96 hours after online publication and is updated daily on week days.
Initial download of the metrics may take a while.