Open Access
Figure 19.
Download original image
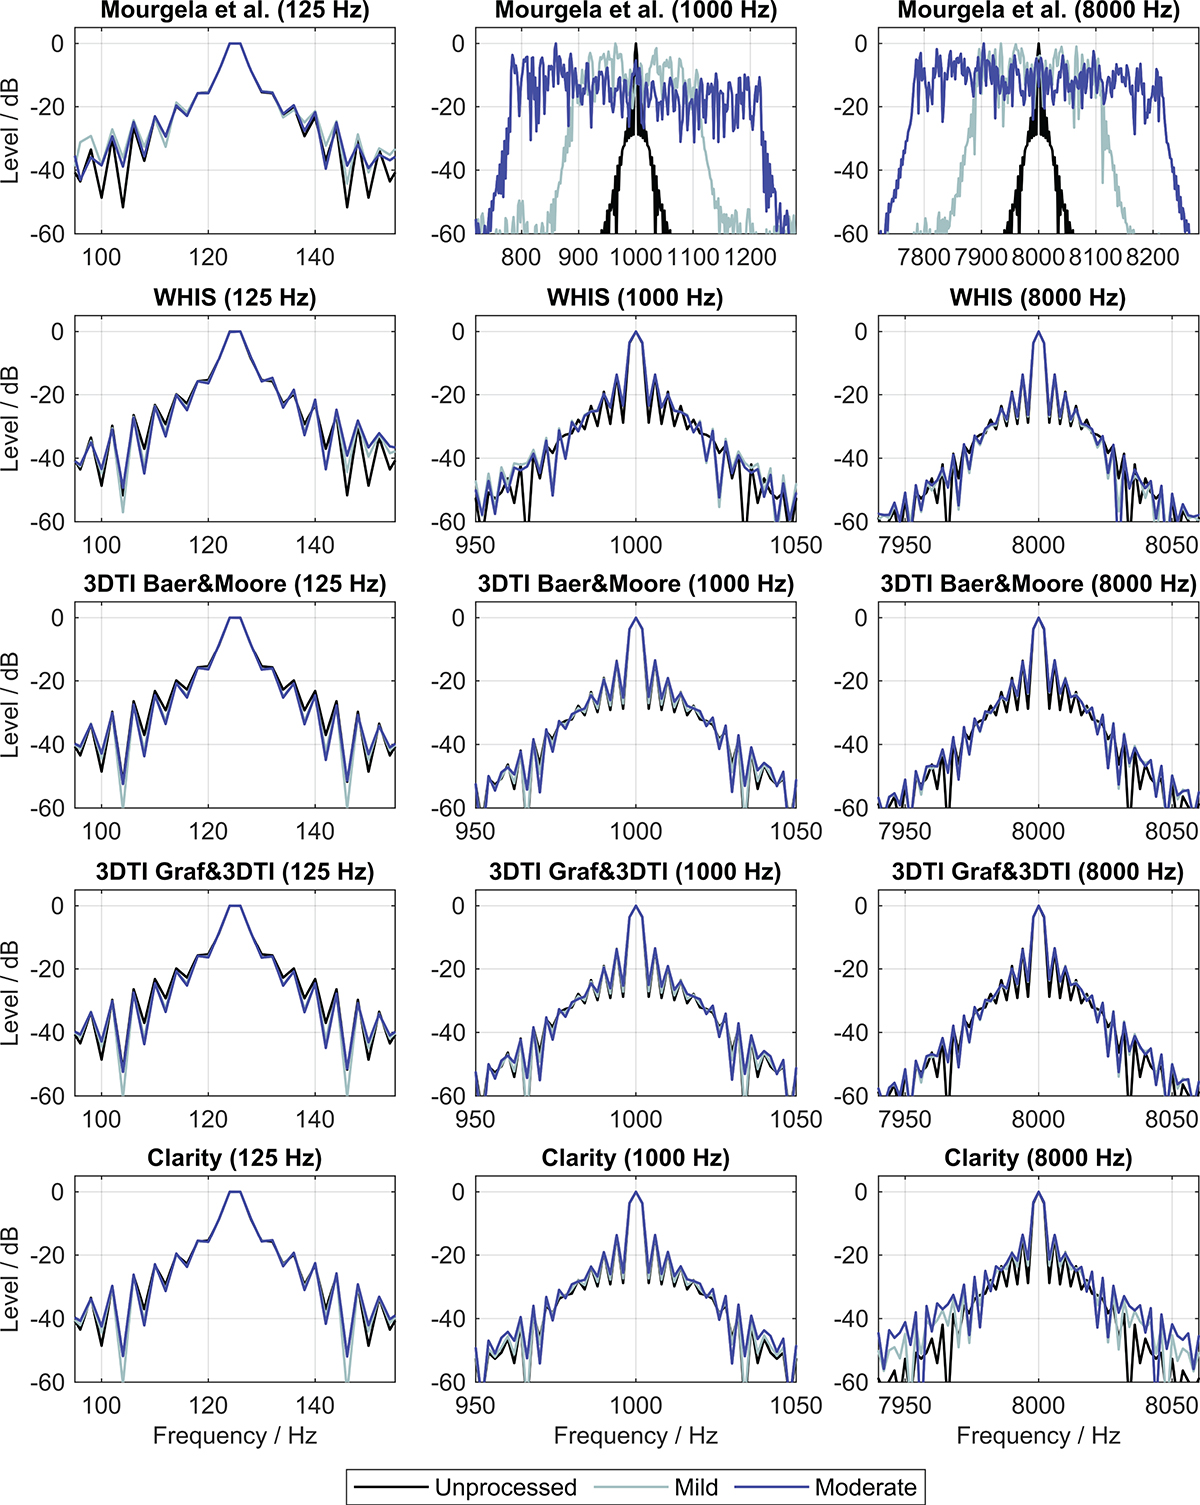
Magnitude spectra of unprocessed audiometric signals and corresponding simulator outputs for the mild and moderate degree of hearing loss conditions. The peak value for each condition was normalised to 0 dB to facilitate comparison. Note the wider frequency range depicted on the abscissa for Mourgela, 1000 Hz and 8000 Hz.
Current usage metrics show cumulative count of Article Views (full-text article views including HTML views, PDF and ePub downloads, according to the available data) and Abstracts Views on Vision4Press platform.
Data correspond to usage on the plateform after 2015. The current usage metrics is available 48-96 hours after online publication and is updated daily on week days.
Initial download of the metrics may take a while.