Figure 2.
Download original image
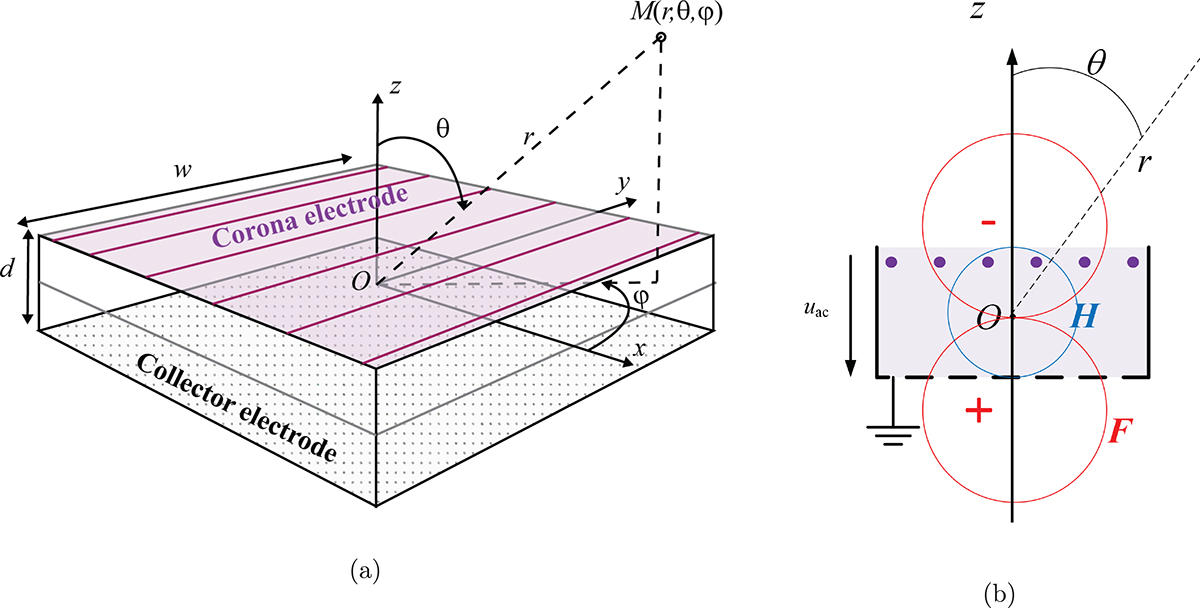
Sketch of a square CDT in free field: (a) 3D representation with cartesian and spherical coordinates definitions; (b) simplified cut view in the x O z plane. The blue circle represents the monopolar heat source, while the red circle pair highlights the dipolar force source, and their relative strength being qualitatively represented by the circles radii.
Current usage metrics show cumulative count of Article Views (full-text article views including HTML views, PDF and ePub downloads, according to the available data) and Abstracts Views on Vision4Press platform.
Data correspond to usage on the plateform after 2015. The current usage metrics is available 48-96 hours after online publication and is updated daily on week days.
Initial download of the metrics may take a while.