


| Issue |
Acta Acust.
Volume 10, 2026
|
|
|---|---|---|
| Article Number | 63 | |
| Number of page(s) | 25 | |
| Section | Speech | |
| DOI | https://doi.org/10.1051/aacus/2026053 | |
| Published online | 21 July 2026 | |
Scientific Article
Sound power of speech between 63 Hz and 20 kHz at a normal vocal effort level
Acoustics Research Unit, School of Architecture, Abercromby Square, University of Liverpool, Liverpool L69 7ZN, United Kingdom
* Corresponding author: This email address is being protected from spambots. You need JavaScript enabled to view it.
Received:
6
February
2026
Accepted:
1
June
2026
Abstract
This paper reports anechoic measurements of speech (720 IEEE sentences) produced at a normal vocal effort by 12 native British English speakers (six male, six female) over a hemispherical region (1 m radius) on one side of the talker to allow calculation of the sound power as well as an assessment of the on-axis sound pressure level and directivity. One-third octave bands were measured from 63 Hz to 20 kHz to include the Extended High Frequency (EHF) range above 7 kHz. In the low-frequency range (below 200 Hz), male talkers had higher levels than female talkers in the 100 Hz and 125 Hz one-third octave bands, and only male talkers had measurable levels in the 63 Hz and 80 Hz bands. In the mid-frequency range (200 Hz–4 kHz) there was a difference between male and female talkers in the 800 Hz one-third octave band where females were ≈3 dB higher than males for the on-axis sound pressure level and ≈2 dB higher for the sound power level. In the high-frequency range (5 kHz–20 kHz), no statistically significant differences were found between male and female talkers; although there were large variations between talkers and between sentences that did, and did not contain the fricatives and the unvoiced affricate . The results show that the definition of a unisex talker spectrum (average of male and female talkers) for the on-axis sound pressure level or sound power level is reasonable between the 160 Hz and 20 kHz one-third octave bands, and between the 125 Hz and 16 kHz octave bands.
Key words: Speech / Sound pressure / Sound power
© The Author(s), Published by EDP Sciences, 2026
 This is an Open Access article distributed under the terms of the Creative Commons Attribution License (https://creativecommons.org/licenses/by/4.0), which permits unrestricted use, distribution, and reproduction in any medium, provided the original work is properly cited.
1 Introduction
The on-axis Sound Pressure Level (SPL) in front of a talker and the sound power of speech are needed to assess a variety of acoustic parameters relating to the transmission of speech in the built environment. Inside a room that contains the talker, the focus is mainly on the prediction of speech intelligibility and assessing distraction or disturbance from speech [1]. Outside the room containing the talker, the assessment usually concerns speech privacy [2] or speech security [3] for which the sound power of speech is used to predict transmission into nearby receiving rooms and assess intelligibility as well as audibility. This paper quantifies the on-axis SPL and sound power at a normal vocal effort over a wider frequency range than is usually considered in the literature, namely from the 63 Hz to 20 kHz one-third octave bands. Male and female spectra are then used to assess the range over which a unisex spectrum is appropriate.
In terms of the SPL in front of a talker, Pearsons et al. [4] measured the Long Term Average Speech Spectrum (LTASS) from male and female talkers (including children) inside an anechoic chamber with a microphone at a distance of 1 m from the mouth. The talkers were asked to repeat a single sentence, “Joe took father’s shoe bench out, she was waiting at my lawn” taking ≈10 s. This was carried out at different vocal effort levels: casual, normal, raised, loud or shouting voice. Average one-third octave band SPLs from 125 Hz to 10 kHz were reported alongside linear and A-weighted SPLs (NB The 10 kHz data were omitted from the summary report by Olsen [5]). A reappraisal of the work by Pearsons et al. that was based on American talkers can be found in Cushing et al. [6] who carried out measurements in an anechoic chamber using the same single sentence as Pearsons et al. but with British talkers. These measurements covered the same range of one-third octave bands but used five microphones with two microphones directly in front of the mouth at distances of 0.5 m and 1 m, and the other three microphones to the left, right and behind the talker at the same height as the mouth. The results showed that the average A-weighted SPLs at different vocal effort levels were within 2 dB of those from Pearsons et al. In both of these studies, the standard deviation for the A-weighted SPLs was 3–4 dB, which indicates a large variation between talkers of this single sentence. It would therefore have been appropriate to normalise the male and female one-third octave band spectra from different talkers to the same A-weighted SPL before calculating the average spectra; however, this was not carried out by Pearsons et al. and Cushing et al. To assess whether a LTASS could be established for a range of languages other than English, Byrne et al. [7] carried out measurements with talkers of 12 languages at a normal vocal effort level. The microphone was 20 cm from the mouth at an azimuth angle of 45° in the horizontal plane at the height of the talker’s mouth. Some, but not all measurements were carried out in an anechoic chamber. It was concluded that LTASS is very similar over a wide range of languages, with no single language being significantly different from any other. They also concluded that male and female spectra, when normalized to the same overall level, were very similar between 250 Hz and 5 kHz. Morales et al. [8] measured the on-axis LTASS from 40 male talkers between 100 Hz and 10 kHz because the male spectrum used in EN 60268-16 [9] appeared not to be representative of typical male speech in the literature. The speech material included the sentence, “Joe took father’s shoe bench out, she was waiting at my lawn.” along with three ten-sentence word lists chosen from the 72 IEEE lists [10]. Compared to the single sentence, the average of three lists differed by 2–3 dB between 5 kHz and 10 kHz; unfortunately, there was no test of statistical significance. This raises the question of how many sentences are necessary to assess the LTASS at high frequencies.
Established measures of speech intelligibility and the LTASS typically have an upper frequency of 8 kHz. For example, the highest band used to determine the Speech Intelligibility Index (SII) is the 8 kHz one-third octave band, and for the Speech Transmission Index (STI), the 8 kHz octave band. Recently there has been increased interest in the Extended High Frequency (EHF) range of speech above 7 kHz and the information that it provides for speech perception and recognition, particularly with fricatives (e.g. see [11–14]). In a study to assess suitable high-frequency gain for hearing-aids, Moore et al. [15] recorded speech material from a passage of prose (≈114 s) at a normal vocal effort. They measured the LTASS up to the 16 kHz one-third octave band inside a booth with sound absorbent surfaces using a microphone that was 30 cm from the mouth in the horizontal on-axis direction and 15 cm below it in the vertical direction. Monson et al. [16] measured the directivity of speech and singing from 15 singers (seven male, eight female) using a semicircle of microphones at 15° azimuthal increments arranged in a horizontal plane that was level with the mouth. The speech materials were 20 six-syllable phonetically representative sentences. At microphone positions that were off-axis, the directivity differed between male and female talkers in the 8 kHz and 16 kHz octave bands. Miller et al. [17] recorded a speech corpus up to 20 kHz using a horizontal, semi-circular array (1 m radius) of 17 microphones in a horizontal plane at the height of the talker’s mouth. Three male and three female talkers recorded a full set of 336 Bamford–Kowal–Bench (BKB) sentences (originally developed for children in 1979) and a partial set consisting of 64 sentences with 15 male and 15 female talkers. From this corpus, Delaram et al. [18] analysed the on-axis recordings and concluded that LTASS levels at EHFs were influenced primarily by talker and gender. As the EHF range is useful for localisation and relevant to conversations between an adult talker and a child listener where the talker’s mouth and the listener’s ears are not in the same horizontal plane, this provides reasons for this paper to quantify the directivity in the EHF range over a spherical surface around the talker, which will also allow calculation of the sound power.
Calculation of the sound power of speech requires knowledge of the directivity in all directions around the talker. Chu and Warnock [19] measured the directivity of normal vocal effort speech from 20 male and 20 female talkers in one-third octave bands from 160 Hz to 8 kHz using a 1 m radius hemisphere with 15° to 20° azimuthal resolution. Fifteen fixed microphones were used with the talker sitting on a chair that could be rotated; hence they had to repeat the speech after each rotation of 15° to complete the hemisphere. The participants were asked to talk on any subject for 40 s and instructed to talk on the same subject matter after rotation without worrying about exact duplication of the words; the use of non-prescribed speech material makes it less likely to have been phonetically balanced. The results showed that there were no significant differences in the directivity of male and female talkers despite their spectral differences.
Quantifying speech output is critical in the field of Standardisation. ISO 3382-3 [20] describes the measurement of room acoustic parameters in open plan offices. This allows an assessment of the spatial decay rate of speech, the speech level at a distance of 4 m and comfort distance (which describes the effect of spatial attenuation in the room/office without paying attention to speech privacy, background noise level, or sound masking); these require calculations using the SPL of omnidirectional speech (normal vocal effort) that is directly related to the sound power of speech. The Standard also refers to EN IEC 60268-16 [21] for STI measurement and subsequent calculation of a distraction distance that relates to speech privacy. ISO 3382-3 gives a sound power spectrum that was estimated from the on-axis ‘standard’ speech spectrum in ANSI S3.5-1997 [22] and the directivity data from Chu and Warnock [19]. In ISO 3382-3, the sound power of speech is stated for a unisex talker (average of male and female talkers) at a normal vocal effort level in octave bands from 125 Hz to 8 kHz. However, the ‘standard’ unisex speech spectrum in ANSI S3.5-1997 only gives octave band SPLs from 250 Hz to 8 kHz, and Chu and Warnock did not measure the directivity in the 100 Hz and 125 Hz one-third octave bands. In ISO 3382-3 it was assumed that the value for the 125 Hz octave band would be 6 dB lower than the 250 Hz octave band. Note that the data from Pearsons et al. and Cushing et al. for a single sentence shows that the 125 Hz octave band is between 6 dB and 14 dB lower than the 250 Hz octave band. This assumption in ISO 3382-3 is therefore assessed in the present study using many sentences because there is uncertainty about the accuracy of the sound power that is quoted for the 125 Hz octave band.
Although speech intelligibility within a room can be estimated using octave bands, the prediction of sound transmission to adjacent rooms for speech privacy or speech security is usually carried out in one-third octave bands. It would be feasible to estimate the sound power spectrum in one-third octave bands using ANSI S3.5-1997 and the Chu and Warnock directivity data. However, this would be limited to one-third octave bands from 160 Hz to 8 kHz, and the airborne sound insulation is often lowest in one-third octave bands below 160 Hz where male talkers typically generate high SPLs near the fundamental frequency of their voice. Although these low frequencies tend not to affect the intelligibility of speech, they may still allow identification of the talker from the fundamental frequency, which can be important for speech security.
This paper reports sound pressure and sound power measurements under anechoic conditions for a normal vocal effort from British English talkers using all 720 sentences in the IEEE speech material [10]. In contrast to previous measurements in the literature that have typically used between 10 s and 120 s of speech material, this equates to ≈40 min. This allows an assessment of the variation in the on-axis SPL between sentences. The aim is to carry out measurements in one-third octave bands from 63 Hz to 20 kHz (which is a wider frequency range than used for sound power measurements in previous studies) and provide sound power data with a large quantity of phonetically balanced speech. This allows an assessment of differences between male and female talkers below 160 Hz and above 8 kHz as well as an assessment of the octave band LTASS used for unisex speech in ISO 3382-3, octave band LTASS used for male and female speech in STI calculations [9, 21] and one-third octave and octave band LTASS used in SII calculations [22]. The need for sound power data in one-third octave bands is also driven by the need to predict the transmission of speech from a space containing a talker to an adjacent space for the purpose of assessing speech security [3]. This usually requires measured or predicted airborne sound insulation in one-third octave bands due to spectral features where there is higher sound transmission (e.g. mass-spring-mass resonances, critical frequencies) and octave band calculations do not provide sufficient accuracy or detail. It also facilitates more accurate calculations of time-averaged, ambient noise levels in spaces such as open-plan offices, meeting rooms and restaurants where it is necessary to quantify the masking noise from other talkers as well as disturbance or annoyance. In situations where there is predominantly upwards masking of target speech, low-frequency energy in the multi-talker babble may mask higher-frequency information that is critical for intelligibility. Recent interest in the EHF range of speech and the information that it provides for speech perception and recognition also gives an opportunity to determine sound power data between 7 kHz and 20 kHz to inform future studies.
2 Experimental work
2.1 Speech material
The speech material was the full set of 720 IEEE sentences [10], sometimes referred to as the ‘Harvard sentences’. This corpus comprises 72 lists where each list has 10 sentences. Each talker recorded the complete set of 720 sentences and was asked to “speak normally as you would in everyday conversation” to elicit a normal vocal effort. The order in which each talker recorded the 72 lists was randomised and the talker could rest their voice between lists. If the talker hesitated or made an error, s/he repeated the sentence. The recorded sentences were automatically segmented using MATLAB, reviewed through listening and visual inspection of the waveform and corrected where necessary.
A broad phonetic assessment of the full set of 720 IEEE sentences is given in Appendix A.
2.2 Talkers
Twelve talkers (six male, six female) were recruited that were native British English speakers with an accent similar to Received Pronunciation (Standard Southern English). Biological sex was the same as self-reported gender. The range of ages was chosen to be similar for males and females. For males, the average age was 35 years; individual ages were 47, 21, 35, 47, 29 and 32 years for male talkers Nos. 1–6 respectively. For females, the average age was 34 years; individual ages were 23, 35, 24, 32, 44 and 45 years for female talkers Nos. 1–6 respectively.
A pure-tone audiometric screening test (125 Hz–8 kHz) was carried out to determine their threshold of hearing. All talkers had a hearing loss less than 20 dB HL or the equivalent age-adjusted value in each band. The fundamental frequency, F0, of each talker was extracted using the Praat periodicity to pitch (raw autocorrelation) method [23] with a time step of 0.1 s (10 candidates per second) using pitch floors and ceilings of 75 Hz and 400 Hz for males, 100 Hz and 500 Hz for females.
2.3 Sound power measurement
The sound power was determined using sound pressure measurements enveloping a virtual surface around the seated talker. This surface formed a spherical dome rather than a complete sphere because the talker’s body and the chair prevented measurements underneath the talker. Due to the availability of 16 channels for simultaneous recording, 16 microphone positions were distributed over a hemisphere of 1 m radius that surrounded the talker on their right side, with the origin of the hemisphere at the mouth of each talker – see Figure 1. Based on previous measurements of the directivity of continuous speech by Chu and Warnock [19], the sound field was assumed to be symmetrical over the hemisphere on the left side of the talker, although for phonemes in isolation (particularly nasals) it has been shown that there can be asymmetries in the horizontal plane between 2 kHz and 8 kHz [24, 25].
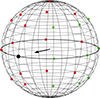 |
Figure 1. Sketch of the measurement surface around the talker. The black arrow indicates the origin of the sphere (mouth position) and the direction that the talker was facing. Circular markers indicate the sampling positions; the large black marker indicates the on-axis microphone, red markers indicate the other 15 microphones, and green markers indicate the positions where it was assumed that the signal was identical to the red marker on the opposite side of the sphere. |
The hemispherical set-up allowed one microphone to be positioned directly above the talker at the top of the sphere with the remaining 15 microphones distributed over three lines of latitude with five microphones on each of these lines. The middle line of latitude formed the ‘equator’ which ensured that one microphone could be placed in front of the talker at a distance of 1 m on-axis. A complete spherical measurement surface would require 26 microphone positions and for each microphone position to represent 1/26 of the total surface area, the polar angle for the upper and lower lines of latitude was π/2 − asin(8/13)=0.91 radians = 52°. The azimuthal angles for the five microphones were defined as 0° (on-axis), 45°, 90°, 135° and 180° (directly behind the talker’s head). Figure 1 shows the 16 microphone positions over the right-hand side hemisphere along with the nine positions on the left-hand side hemisphere which were assumed to be identical to the corresponding microphone positions on the right-hand side hemisphere.
The surface area that is represented by each of the 16 microphones is 2π/13 m2 but because the talker’s body and chair effectively remove the possibility for a lower microphone position underneath the seat, the measurement surface that was used to calculate the sound power is a spherical dome with a surface area of 4π − 2π/13 = 50π/13 m2.
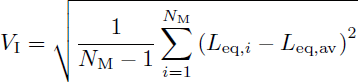
For the determination of sound power, ISO 3745 [26] gives an estimate of the uncertainty due to spatial sampling over the surface of the hemisphere with the 16 microphones. The surface SPL non-uniformity index, V I, for N M microphones at a radius, r = 1 m, around the source is calculated using
 (1)
(1)
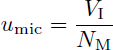
where Leq, i is the background noise corrected, equivalent continuous SPL for the ith microphone and Leq, av is the arithmetic average of Leq, i over all microphone positions on the measurement surface. The number of microphone positions, N M = 25, because nine of the 16 microphone positions are essentially reflected over to the imaginary hemisphere on the left side of the talker to calculate sound power over the entire surface of the spherical dome. The uncertainty, u mic, in decibels due to the finite number of microphone positions can then be calculated using
 (2)
(2)
Background noise corrections for the sound power measurements used the procedure in Section 9.4.2 of ISO 3745. When the difference between the measured SPL and background is ΔL i , the background noise correction in dB, K i , is
 (3)
(3)
The correction, K i , from equation (3) is applied when (a) 6 dB ≤ΔL i < 15 dB, at and below 200 Hz, and at and above 6.3 kHz and (b) 10 dB ≤ΔL i < 15 dB, from 250 Hz to 5 kHz. When ΔL i < 6 dB in any band at and below 200 Hz or at and above 6.3 kHz, K i = 1.26 dB (corresponding to ΔL i = 6 dB). If ΔL i < 10 dB in any band from 250 Hz to 5 kHz, K i = 0.46 dB (corresponding to ΔL i = 10 dB). When ΔL i ≥ 15 dB, K i = 0 dB.
2.4 Sound pressure levels
For the on-axis microphone, the percentage of the 720 sentences that was at least 10 dB above background noise was 92.2% for male talkers from 63 Hz to 20 kHz, and 94.7% for female talkers from 100 Hz to 20 kHz. The background noise only tends to become an issue where talkers typically have low speech energy, i.e. above 10 kHz where the background noise for microphones is primarily stable electrical noise in the measurement chain and below 100 Hz due to steady ambient noise. Due to the stability of the background noise, it was considered appropriate to process sentences that were at least 4 dB above background and make a background noise correction using equation (3). This increased the available percentages of sentences to 97.1% for male talkers and to 98.9% for female talkers over the same frequency ranges.
Compared to the on-axis microphone, the SPL from the other 15 microphones tended to be lower. For consistent processing of SPLs from all microphones when calculating the directivity of speech, the background noise correction, K i , was applied when 4 dB ≤ΔL i < 15 dB and sentences were not used to calculate the frequency band average if ΔL i < 4 dB. An additional requirement was that at least 10% of the 720 sentences had to satisfy the criterion, ΔL i ≥ 4 dB, in a one-third octave band before calculating an average value for a talker in that band. Note that the lower limit of ΔL i = 4 dB corresponds to a correction of K i = 2.20 dB. This differs from the ISO 3745 background correction procedure that was used for sound power because the processing of 16 microphone positions means that a few microphone positions with levels close to background tend to have negligible effect on the sound power level.
2.5 Equipment and test chamber
The speech measurements used free-field, half-inch microphones (Bruel & Kjær Type 4190, 4189, 4165, 4155 and GRAS Type 40AF and 40AS) into NEXUS conditioning amplifiers (20 Hz high pass filter and a 22.4 kHz low pass filter). The recordings were stored using the Bruel & Kjær Time Data Recorder with a sampling rate of 65536 Hz (22.4 Hz high pass filter).
The on-axis (0°) free-field response from 20 Hz up to 20 kHz was ±2 dB for 14 of the microphones (including the microphone that was used at the on-axis position at 1 m in front of the mouth). However, the two GRAS 40AS microphones were outside of this specification between 5 kHz and 20 kHz, with values between 2 dB to 5.2 dB; hence corrections were applied so that they gave the same 0° free-field response as the on-axis microphone. Apart from the on-axis microphone, the sound incident upon each microphone could potentially include other angles of incidence due to reflection and scattering of the speech from the human body; hence the 0° free-field response reported on the calibration sheets was not used to make any correction to the measured levels.
The dimensions of the anechoic chamber were 5 m × 4 m × 2.95 m. For precision sound power measurements in an anechoic chamber, ISO 3745 Annex A [26] describes qualification procedures for a chamber based on the maximum allowable deviations from the inverse square law. These indicate that the lower limiting frequency was just below the 125 Hz one-third octave band. However, speech signals were measurable down to the 63 Hz band. For this reason, it is instructive to use Annex B for the qualification because the hemispherical measurement surface only occupies a portion of the chamber’s volume. This required two measurement hemispheres. The first hemisphere corresponded to the one used with the talkers and had a radius of 1 m. The second hemisphere had a radius of 1.42 m (a greater radius was not possible due to the dimensions of the anechoic chamber) which gave a surface area that was larger than the actual measurement surface by a factor of 2.02 with measurement locations that corresponded to those on the first hemisphere. The source was broadband noise from an omnidirectional loudspeaker (Bruel & Kjær Omnisource Type 4292-L) because the focus was on low-frequencies where it is reasonable to assume that talkers are omnidirectional. The absolute difference between the sound power levels from the two hemispheres is required to be ≤0.5 dB for precision measurements according to ISO 3745. At 63 Hz and 125 Hz this requirement was satisfied, but at 80 Hz and 100 Hz the absolute differences were 1.3 dB and 1.1 dB respectively. Although the size of the loudspeaker and the broadband signal are not representative of the actual talkers, this indicates that for the 80 Hz and 100 Hz one-third octave bands the measurements could be considered as ‘engineering’ rather than ‘precision’ grade.
ISO 3745 Table 1 [26] gives absolute criteria for the maximum background noise levels allowed inside the chamber from 50 Hz to 20 kHz and these were all satisfied except at 6.3 kHz which was exceeded by 0.8 dB. The ISO 3745 requirements at 16 kHz and 20 kHz allow unusually high background noise levels of 46 dB but the measured background noise levels in the anechoic chamber were much lower, being ≈10 dB in both bands.
The environmental conditions in the anechoic chamber were stable during the recordings with a temperature range of 19–21 °C and 50–60%RH. The corrections to the sound power level according to ISO 3745 [26] for these environmental conditions were calculated as being 0.1–0.2 dB between 20 Hz and 20 kHz. These were considered negligible, and therefore no corrections were made for the different talkers.
Each talker was seated on a chair with a footrest, but no arm rests; hence there were open sides. They were asked to remain still when talking and to rest their hands palm down on top of their thighs. The metal base of the chair was covered in sound absorptive material. The top of the backrest was below the height of the underarm of the seated talker and because there was no headrest on the chair, there was a clear unobstructed line from the back of the head to the microphones that were positioned behind the head.
A small video display (205 mm wide × 170 mm high × 30 mm thick) was used to present each sentence to the talker. This was positioned at a distance of ≈1.5 m from the talker and offset from the on-axis microphone by ≈15° towards their right side. The talker was instructed to face the on-axis microphone and to only move their eyes slightly to the side (i.e. not their head) when reading the sentences. Using a Bruel & Kjær Type 4128 HATS as a speech simulator, the effect of the video display on the SPL was measured to be < 0.2 dB over the entire frequency range; this was considered to be negligible, and no correction was made.
3 Results
3.1 Talker fundamental frequencies
The F0 mean was calculated for each signal and averaged for each talker over all 720 sentences. For males, the average F0 was 117 Hz; individual F0 values were 108, 98, 110, 135, 132, 116 Hz for male talkers Nos. 1–6 respectively. For females, the average F0 was 196 Hz; individual F0 values were 199, 206, 212, 197, 156, 207 Hz for female talkers Nos. 1–6 respectively. For males and females, the average F0 values were 117 Hz and 196 Hz respectively; these are representative of male and female speakers of English in conversation or when reading (e.g. see [27, 28]).
3.2 On-axis sound pressure level
The on-axis SPLs in this section are considered in terms of their A-weighted levels, one-third octave band spectra and octave band spectra.
3.2.1 A-weighted levels
Pearsons et al. [4] determined the mean (M) and standard deviation (σ) for the A-weighted equivalent continuous SPL, L Aeq, of normal vocal effort speech at 1 m on-axis in anechoic conditions for males (N = 42, M = 58 dB, σ = 4 dB) and females (N = 35, M = 55 dB, σ = 4 dB). These are similar to values measured by Cushing et al. [6] for males (N = 34, M = 58 dB, σ = 3 dB) and females (N = 16, M = 56 dB, σ = 3 dB). Using the raw data from Pearsons et al., there was no evidence of a significant difference between Pearsons et al. and the present study for male talkers (N = 6, M = 55.7 dB, σ = 2.3 dB) and for female talkers (N = 6, M = 53.4 dB, σ = 3.8 dB). Note that Pearsons et al. and Cushing et al. only required the talkers to say a single 12-word sentence (‘Joe took father’s shoe bench out, she was waiting at my lawn’) at different vocal effort levels (e.g. normal, raised, loud). In contrast, the results in the present study were based on 720 sentences and the talkers were only instructed to speak at one vocal effort level.
To allow a comparison of speech spectra from male and female talkers and to consider the definition of LTASS for a unisex talker, it is necessary to normalise the spectra from all talkers to a specified L Aeq at 1 m on-axis. A normal or raised vocal effort level is predominantly used to assess speech intelligibility, privacy and security. The studies by Pearsons et al. and Cushing et al. show that the LTASS is similar for normal and raised vocal efforts and that average L Aeq values for male and female talkers span a range from 55 dB to 67 dB. In the present study the talkers used a normal vocal effort for which ISO 3382-3 uses a value of 59.5 dB L Aeq for a unisex talker in an open plan office and ISO 9921 [29] uses 60 dB L Aeq as a typical value for a male talker. Hence, this paper uses a value of 60 dB L Aeq to represent a normal vocal effort and to normalise all one-third octave band SPLs for each sentence from each male and female talker. Note that A-weighted values that were subsequently calculated from the octave band spectra by combining the one-third octave bands gave 60.0 dB L Aeq for the average male talker, 60.1 dB L Aeq for the average female talker, and 60.0 dB L Aeq for the unisex talker.
3.2.2 One-third octave bands
Figure 2 allows a comparison of the one-third octave band SPLs from each of the 12 talkers in terms of the average level calculated across all sentences. For each talker, the mean and standard deviation of LAeq at 1 m on-axis are given in the legend. The average speech levels were closest to background noise for male talkers at 63 Hz and 20 kHz and for female talkers at 100 Hz and 20 kHz but average values could be calculated based on the background noise requirements described in Section 2.4.
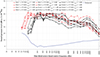 |
Figure 2. Sound pressure level in one-third octave bands at 1 m on-axis from the six male and six female talkers averaged over all sentences. |
For individual male or female talkers shown in Figure 2, there are differences of up to 16 dB in the one-third octave bands. Hence, to allow a comparison of male and female talkers, the spectrum of each individual sentence from each talker is normalised to 60 dB LAeq (which is representative of a normal vocal effort at 1 m on-axis) before calculating the average for each gender. The average normalised SPLs for individual male and female talkers are shown in Figure 3. Due to the importance of the mid-frequency range in determining the A-weighted values, the curves from the 12 talkers are seen to cluster together between 400 Hz and 4 kHz. However, there are differences between the talkers that are > 5 dB below 400 Hz and above 4 kHz. At 8 kHz and 10 kHz there is a range of ≈20 dB between all 12 talkers. Female talker No.5 had a notably lower F0 than the other females, although not as low as the male talkers (refer back to Sect. 3.1); this resulted in higher levels in the 100 Hz, 125 Hz and 160 Hz bands compared to the other female talkers.
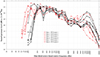 |
Figure 3. Sound pressure level in one-third octave bands at 1 m on-axis (after normalisation of each sentence to 60 dB L Aeq) from the six male talkers and six female talkers averaged over all sentences. |
The average normalised SPLs for male and female talkers are shown in Figure 4 (and tabulated in Tab. B.1, Appendix B) in terms of the average value with 95% confidence intervals at each one-third octave band; note that these spectra also correspond to 60 dB LAeq. In the 63 Hz and 80 Hz bands the SPL was only measurable above background for male talkers. In the 100 Hz, 125 Hz and 800 Hz bands there were statistically significant differences between male and female talkers. At 100 Hz, male talkers (M = 52.9 dB, SE = 1.5 dB) had a 17.8 dB higher level than female talkers (M = 35.1 dB, SE = 2.7 dB) where t(10.0)=6.84, p < 0.01, r = 0.91. At 125 Hz, male talkers (M = 54.6 dB, SE = 1.4 dB) had a 6.3 dB higher level than female talkers (M = 48.3 dB, SE = 4.5 dB) where t(5.9)=3.88, p < 0.01, r = 0.85. At 800 Hz, female talkers (M = 52.2 dB, SE = 0.6 dB) had a 2.9 dB higher level than male talkers (M = 49.3 dB, SE = 0.2 dB) where t(6.3)= − 4.18, p < 0.01, r = 0.86. There were no statistically significant differences (p > 0.05) between male and female talkers in the EHF range (8 kHz–20 kHz). The large differences between male and female talkers at 100 Hz and 125 Hz have implications for the definition of a unisex spectrum.
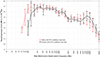 |
Figure 4. Sound pressure level in one-third octave bands at 1 m on-axis (after normalisation of each sentence to 60 dB L Aeq) in terms of the mean with 95% confidence intervals from the six male talkers and six female talkers averaged over all sentences. |
Figure 5 allows comparison of the average normalised SPL for male and female talkers from the present study with male and female normal vocal effort spectra from Pearsons et al. [4], Cushing et al. [6], Moore et al. [15] and Morales et al. [8] (male talkers only) as well as the ‘standard’ and ‘idealised’ unisex normal vocal effort spectra from ANSI S3.5 [22] (Note that the microphone position used by Moore et al. was only 30 cm from the mouth in the horizontal direction and 15 cm below it in the vertical direction. Above 8 kHz, the estimated effect of directivity on this microphone position is a reduction of up to 3 dB compared to on-axis; see directivity results in Sect. 3.3.). For this comparison, all spectra have been normalised to 60 dB LAeq. In the 125 Hz and 160 Hz bands, the average values for female talkers from Pearsons et al. and Cushing et al. were ≈16 dB and ≈7 dB lower than average values from the present study. For female talkers in the present study, these two frequency bands had the widest 95% confidence intervals although the average values from Pearsons et al. and Cushing et al. tended to fall beneath the lower 95% confidence interval. Due to the differences between individual sentences (as well as between talkers), the use of a single 12-word sentence by Pearsons et al. and Cushing et al. does not provide a representative LTASS at low frequencies. Between 200 Hz and 3.15 kHz, average values for male and female talkers from Pearsons et al. and Cushing et al. all tend to fall within the 95% confidence intervals of the present study. Above 3.15 kHz the average values from Pearsons et al. and Cushing et al. tend to fall beneath or just outside the lower 95% confidence intervals. Moore et al. allows comparisons with the present study in the 10 kHz, 12.5 kHz and 16 kHz bands where the male and female talkers tend to fall just below or within the lower 95% confidence interval. If a 3 dB allowance is made for the use of an off-axis microphone position these would all fall within the confidence interval of the present study. For male talkers only, Morales et al. calculated an average from three of the IEEE word lists which fell within the 95% confidence intervals of male talkers from the present study in all bands except 500 Hz and 800 Hz. Compared to the male talkers in the present study the average values from Morales et al. were ≈3 dB lower at 100 Hz, 125 Hz and 160 Hz and ≈4 dB lower at 8 kHz and 10 kHz.
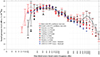 |
Figure 5. Sound pressure level in one-third octave bands at 1 m on-axis (after normalisation of each sentence to 60 dB L Aeq) from the six male and six female talkers averaged over all sentences and spectra quoted in Standards and previous studies. |
ANSI S3.5 [22] gives unisex ‘standard’ and ‘idealised’ normal vocal effort spectra in one-third octave bands where the ‘standard’ speech spectrum is described as “averaged across a large group of adult male and female talkers”. At 100 Hz, the ‘idealised’ unisex spectrum only falls within the 95% confidence intervals for male talkers in the present study whereas at 125 Hz this only occurs for female talkers. Between 160 Hz and 2.5 kHz, there is agreement between male and female talkers from the present study with ANSI S3.5 ‘standard’ and ‘idealised’ unisex normal vocal effort spectra which tend to fall within the 95% confidence intervals of the present study. At and above 3.15 kHz, both the ‘standard’ and ‘idealised’ spectra fall beneath the lower 95% confidence intervals for male and female talkers from the present study. Between 500 Hz and 8 kHz, the ANSI S3.5 ‘standard’ and ‘idealised’ spectra decrease by, on average, −5.3 dB/octave and exactly −6 dB/octave respectively. Results from the present study and other studies indicates that a −6 dB/octave slope from 2 kHz to 8 kHz is too steep to represent sentences at a normal vocal effort level. Based on the present study, a more suitable idealisation would be a frequency-independent level from 2 kHz to 10 kHz with a value equal to that at 2 kHz, followed by a −18 dB/octave slope from 10 kHz to 20 kHz.
Figure 6 shows the standard deviations of the normalised SPL from male and female talkers for (a) the 720 individual sentences and (b) the 72 list averages that were each calculated from the ten constituent sentences. Note that values are only calculated and plotted when (a) at least 10% of sentences have valid measurements and (b) at least seven word lists (i.e. ≈10%) have ten valid sentences. For male and female talkers, the standard deviation of the list averages is, on average, 1.1 dB below 1 kHz, and 1.3 dB above 1 kHz. These are considerably lower than the standard deviations of all the sentences which are, on average, 2.5 dB below 1 kHz and 3.5 dB above 1 kHz; note that the standard deviations increase up to 5.6 dB for one male talker at 12.5 kHz and one female talker at 10 kHz. For speech security where it is critical to quantify the potential for information leakage [3], it is useful to quantify the range of SPLs in each band for individual sentences; hence Figure 7 shows the range of the normalised SPLs from male and female talkers for (a) the 720 individual sentences and (b) the 72 list averages. For individual sentences the average range for male and female talkers is 18.2 dB, but for list averages, this reduces to 5.5 dB.
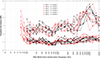 |
Figure 6. Standard deviation of the sound pressure level in one-third octave bands at 1 m on-axis (after normalisation of each sentence to 60 dB L Aeq) from the six male talkers and six female talkers for (a) all sentences (shown with dashed lines) and (b) for all lists (shown with solid lines). |
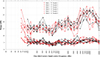 |
Figure 7. Range of the sound pressure level in one-third octave bands at 1 m on-axis (after normalisation of each sentence to 60 dB L Aeq) from the six male talkers and six female talkers for (a) all sentences (shown with dashed lines) and (b) for all lists (shown with solid lines). |
The difference between the average normalised SPLs for male and female talkers from the present study and the previous studies by Pearsons et al. and Cushing et al., are potentially due to the different speech material. Pearsons et al. and Cushing et al. used a single 12-word sentence whereas the present study used 720 sentences where each sentence had an average of eight words (ranging from five to 12 words). Each word list contains ten sentences and has an average of 80 words with a range from 70 to 93 words over all word lists. Considering the standard deviations in Figure 6, there is seen to be a large variation in the normalised SPLs between individual sentences for each talker and a notable increase in the standard deviations above 3.15 kHz. The phonemes that contain high-frequency energy above 3.5 kHz are typically the fricatives and (often with higher intensity for the former [30]) and the unvoiced affricate . In the full set of 720 sentences there are 12 sentences that do not contain the above fricatives and unvoiced affricate. For both male and female talkers, the spectrum in Figure 4 is relatively flat from 2 kHz to 6.3 kHz with a slight peak in the spectrum for female talkers at 8 kHz before the level decreases from 10 kHz to 20 kHz by 15.5 dB/octave for male talkers and 17.5 dB/octave for female talkers. (Note that the speech spectrum measured by Chu and Warnock [19] is also relatively flat from 2 kHz to 8 kHz for male and female talkers but their focus was on directivity relative to the on-axis microphone, hence their results were not tabulated and may not have been normalised to a specified L Aeq for each talker before averaging.) There is a notable increase in the 95% confidence intervals above 4 kHz due to the variation in the normalised SPLs for individual sentences (refer back to Figs. 6 and 7).
Figure 8 shows the normalised SPL for the 720 sentences from all male and female talkers with sentences highlighted in magenta that do not contain the fricatives and the unvoiced affricate . Considering all 720 sentences from all male and female talkers, the range of normalised SPLs is, on average, 23 dB between 200 Hz and 4 kHz but between 5 kHz and 16 kHz, this increases to 36 dB. For male talkers, sentences with had a higher SPL than sentences without them by 9.4 dB at 8 kHz (t(74.9)=12.9, p < 0.01, r = 0.83), by 10.2 dB at 10 kHz (t(77.3)=14.1, p < 0.01, r = 0.85), by 10.1 dB at 12.5 kHz (t(77.6)=15.4, p < 0.01, r = 0.87), by 7.6 dB at 16 kHz (t(69.5)=15.9, p < 0.01, r = 0.89) and by 5.7 dB at 20 kHz (t(30.9)=7.7, p < 0.01, r = 0.81); these were the only bands above 3.5 kHz where there were large effect sizes. For female talkers, sentences with had a higher SPL than sentences without them by 10.1 dB at 8 kHz (t(75.2)=17.4, p < 0.01, r = 0.89), by 12.2 dB at 10 kHz (t(77.4)=23.1, p < 0.01, r = 0.93), by 11.1 dB at 12.5 kHz (t(76.5)=22.9, p < 0.01, r = 0.93), by 8.8 dB at 16 kHz (t(58.1)=15.8, p < 0.01, r = 0.90) and by 7.5 dB at 20 kHz (t(29.0)=14.8, p < 0.01, r = 0.94); these were the only bands above 3.15 kHz where there were large effect sizes. Sentences that include have a higher average SPL between 5 kHz and 20 kHz than those sentences without them.
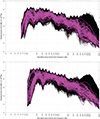 |
Figure 8. Sound pressure level in one-third octave bands at 1 m on-axis (after normalisation of each sentence to 60 dB L Aeq) for all individual sentences from the six male talkers (upper graph) and the six female talkers (lower graph). For each talker, the IEEE sentences are shown in black with the 12 sentences which do not contain shown in magenta. |
Figure 9 allows a comparison of the average normalised SPL for male and female talkers from (a) all 720 sentences with (b) the 12 sentences that do not contain . Up to 4 kHz, the differences between them are < 2 dB whereas between 5 kHz and 20 kHz the average of the 12 sentences is lower by, on average, 8.1 dB. The remainder of this paper focuses on the full set of 720 sentences from all talkers.
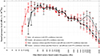 |
Figure 9. Sound pressure level in one-third octave bands at 1 m on-axis (after normalisation of each sentence to 60 dB L Aeq) in terms of the mean with 95% confidence intervals from the six male talkers and six female talkers averaged over (a) all 720 sentences (lines without markers) and (b) the 12 sentences that do not contain (lines with circular markers). |
3.2.3 Octave bands
Converting the measured one-third octave bands into octave bands allows comparison of the average male and female talkers with (a) male and female talkers from Pearsons et al. [4], (b) male and female talkers from Cushing et al. [6], (c) male and female talkers from Monson et al. [16], (d) male talkers from Morales et al. [8], (e) male and female spectra from Table A.4 in EN 60268-16:2011 [9], and (f) male spectra from Table A.4 in EN IEC 60268-16:2020 [21]. All data from these sources were normalised to 60 dB LAeq for comparison with the present study. These are shown in Figure 10 and tabulated in Table B.2, Appendix B. A comparison is also made for a unisex talker (calculated from all 12 talkers in the present study) with (a) ‘standard’ and ‘idealised’ unisex normal vocal effort spectra from ANSI S3.5 [22] and (b) unisex (directional) normal vocal effort spectrum from Table 1 in ISO 3382-3 [20]. All data from these sources were normalised to 60 dB LAeq for comparison with the present study in Figure 11. In cases where the spectra in Standards or previous studies were only available in one-third octave bands, these data were used to calculate the octave bands. Note that no values are given for the 125 Hz octave band with the ANSI S3.5 ‘standard’ spectrum and the EN 60268-16:2011 female spectrum.
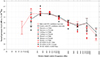 |
Figure 10. Sound pressure level in octave bands at 1 m on-axis (after normalisation of each sentence to 60 dB L Aeq) from the six male and six female talkers averaged over all sentences for comparison with male and female spectra quoted in Standards and previous studies. |
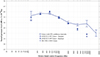 |
Figure 11. Sound pressure level in octave bands at 1 m on-axis (after normalisation of each sentence to 60 dB L Aeq) for a unisex talker averaged over all sentences for comparison with unisex spectra quoted in Standards. |
In the 125 Hz octave band, male talkers (M = 58.2 dB, SE = 1.3 dB) had a 5.1 dB higher SPL than female talkers (M = 53.1 dB, SE = 2.4 dB) where t(10)=3.21, p < 0.01, r = 0.71. Average values for male talkers from Pearsons et al. and Cushing et al. are 6.4 dB lower than the average male talker from the present study. Average values for female talkers from Pearsons et al. and Cushing et al. are lower than the average female talker from the present study by 10.1 dB and 6.9 dB respectively. In addition, the average values for male and female talkers from Pearsons et al. and Cushing et al. are lower than the corresponding lower 95% confidence interval from the present study. The low values from these previous studies are attributed to their use of the single 12-word sentence. The EN 60268-16:2011 male spectrum is 4.7 dB higher than the average male talker from the present study and is above the upper 95% confidence interval. However, the EN IEC 60268-16:2020 male spectrum is within 0.7 dB of the average value from the male talkers in the present study which indicates that the change in the 2020 version of this Standard was appropriate.
In the 250 Hz octave band, the EN 60268-16:2011 male and female spectra are too high to be representative of an average male or female talker by 4.6 dB (male) and 6.8 dB (female) whereas the EN IEC 60268-16:2020 male spectrum is only 2.3 dB higher than the average male talker from this study.
In the 500 Hz octave band, EN 60268-16:2011 and EN IEC 60268-16:2020 are within 1.4 dB of the male and female talkers from this study. In the 1 kHz octave band, the EN 60268-16:2011 female spectrum is 4.4 dB below the female talkers from the present study. For the 500 Hz and 1 kHz octave bands, the average values for male and female talkers from the present study, Pearsons et al. and Cushing et al. are within 1.8 dB of each other. This indicates that the single 12-word sentence was representative of the full set of 720 IEEE sentences in these two bands.
At and above the 2 kHz octave band, the general trend is that the EN 60268-16:2011 male and female spectra and the EN IEC 60268-16:2020 male spectrum becomes increasingly lower than the average male and female talkers from the present study (and lower than those in previous studies by Pearsons et al. and Cushing et al.). At 2 kHz, 4 kHz and 8 kHz, the EN 60268-16:2011 male and female spectra are, on average, 4.3 dB, 5.6 dB and 10.4 dB lower than the average values from the present study. EN IEC 60268-16:2020 only gives values for male talkers and these are 1.8 dB, 6.8 dB and 12.2 dB lower than the average value for male talkers from the present study. This suggests that the current spectrum in EN IEC 60268-16:2020 requires re-consideration in these high-frequency bands. For male talkers only, Morales et al. calculated an average from three of the IEEE word lists which fell within the 95% confidence intervals of male talkers from the present study in all bands. For male talkers, the largest differences between the present study and Pearsons et al. or Cushing et al. were, on average, 6.4 dB at 125 Hz and 8.2 dB at 8 kHz, whereas for female talkers they were, on average, 8.5 dB at 125 Hz and 6.8 dB at 8 kHz. This indicates that whilst mid-frequencies can be assessed using the single 12-word sentence used by Pearsons et al. or Cushing et al., it is not appropriate to use this sentence to give a representative average at high (as well as low) frequencies. In contrast, Monson et al. [16] used 20 six-syllable phonetically representative sentences and the agreement with male and female talkers from the present study in the 2 kHz, 4 kHz, 8 kHz, and 16 kHz octave bands was, on average, within 1.2 dB, with the largest difference being 3.6 dB at 16 kHz for male talkers. The data from Monson et al. fall within the 95% confidence intervals of the present study. At 8 kHz, none of the data points from Pearsons et al., Cushing et al., Monson et al. and Morales et al. were within the upper 95% confidence interval of male or female talkers from the present study.
Comparison of the unisex spectra from the present study with ANSI and ISO Standards (Fig. 11) indicates that the largest differences occur in the 125 Hz, 4 kHz and 8 kHz octave bands. In the 125 Hz octave band, the ANSI S3.5 ‘idealised’ spectrum is 1.6 dB lower than the present study, although it falls within the 95% confidence intervals, and the ISO 3382-3 spectrum is 4.7 dB lower than the present study and falls outside the confidence intervals. In the 4 kHz and 8 kHz octave bands, the ANSI S3.5 ‘standard’ spectrum and the identical ISO 3382-3 spectrum are lower than the present study by 3.6 dB and 9.9 dB respectively, with the ANSI S3.5 ‘idealised’ spectrum being lower by 4.9 dB and 12.0 dB respectively.
ANSI S3.5 1997 notes that “measurement of a stable and accurate speech spectrum level requires a large number of talkers (at least 20 talkers and 30 s speech samples from each are recommended).” As the ANSI S3.5 ‘standard’ spectrum falls below the lower 95% confidence interval for male and female talkers in the 4 kHz and 8 kHz octave bands (and also in the 3.15 kHz, 4 kHz, 5 kHz, 6.3 kHz and 8 kHz one-third octave bands) it may be appropriate to replace the need for a 30 s sample with the requirement for a minimum number of phonetically balanced word lists. In addition, the similarity between male and female talkers suggests that at least six male and six female talkers is sufficient to calculate a unisex talker. For future consideration of the EHF range, the increase in the 95% confidence intervals of the on-axis SPL for male and female talkers above 3.15 kHz emphasises the importance of considering large numbers of sentences from phonetically balanced word lists. Based on the present study, a more suitable idealisation for the speech spectrum would be a frequency-independent level from 2 kHz to 8 kHz with a value equal to that at 2 kHz, followed by a −9 dB/octave slope from 8 kHz to 16 kHz.
For a unisex talker, ISO 3382-3 assumes that the on-axis SPL for the 125 Hz octave band would be 6 dB lower than the 250 Hz octave band due to the absence of information at 125 Hz in ANSI S3.5; however, the present study indicates it is only 2.0 dB lower. Note that for male and female talkers, the present study indicates it would be 0 dB and 5.4 dB lower respectively, whereas Pearsons et al. had 6 dB and 14 dB lower values respectively and Cushing et al. had 7 dB and 12 dB lower values respectively. These large differences from Pearsons et al. and Cushing et al. indicate that using the single 12-word sentence is not robust when determining average values in the low-frequency range.
3.3 Variation in sound pressure level over the hemispherical measurement surface
A summary of historical measurements on the directivity of speech (and singing) can be found in Pörschmann [31]; this illustrates the variation that exists in terms of speech material, talkers (sitting or standing human talkers or head and torso systems), sampling points (azimuth and elevation angles), and microphone distance from the mouth. Note that the microphone positions in the present study were chosen for the purpose of quantifying the sound power level rather than to provide detailed directivity at regular angular increments of azimuth and elevation. The directivity in one-third octave bands is calculated from the average SPL from all sentences at each microphone after normalisation to the frontal, on-axis microphone; these results are shown with 95% confidence intervals for male, female and unisex talkers in Figure 12.
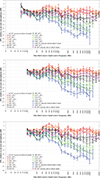 |
Figure 12. Sound pressure level in one-third octave bands from all 16 microphones normalised to the frontal, on-axis microphone for unisex talkers averaged over all sentences with 95% confidence intervals: male talkers (upper), female talkers (middle) and unisex (lower). Legends indicate microphone positions in terms of (azimuth angle, elevation angle). |
Only male talkers produced measurable SPLs in the 63 Hz band and when the elevation angle was −38°, the level in this band was, on average, 4.4 dB higher than the on-axis microphone, perhaps due to sound radiation from the vibration of the chest wall. Whilst Sundberg [32] has previously measured higher chest wall vibration from male singers in this frequency range, this does not necessarily mean that there is efficient sound radiation; hence further work is required on this aspect. The average difference (magnitude) between male and female talkers from all microphones (other than the on-axis microphone which is used for normalisation) is 0.3 dB over the frequency range from 100 Hz to 20 kHz. Due to normalisation to the on-axis microphone, it is reasonable to average the directivities from male and female talkers to give a unisex directivity pattern over this frequency range. These unisex directivities are given in Table B.3, Appendix B. When the azimuth angle is ≥90° there tends to be a decrease of ≈5 dB from the 1 kHz to the 1.25 kHz one-third octave band. Above 1 kHz, the level is lower than the on-axis microphone by 6–17 dB when the azimuth angle is 135° and by 6–23 dB when the azimuth angle is 180°. To the side of the talker’s head (90°, 0°) the level is lower than the on-axis microphone by, on average, 1.2 dB between 100 Hz and 1 kHz and 7.1 dB between 1.25 kHz and 20 kHz. Directly above the talker’s head (0°, 90°) the level is, on average, 3.3 dB lower than the on-axis microphone between 100 Hz and 20 kHz.
Chu and Warnock [19] measured the directivity of seated male and female talkers in one-third octave bands between 160 Hz and 8 kHz. Male and female talkers were found to be similar. The majority of their microphones were at different positions in terms of azimuth and elevation angles, but there were three microphones at the same positions as the present study, these were (0°, 90°), (90°, 0°) and (180°, 0°). At these positions, the average difference between the directivity values from the present study and Chu and Warnock was −0.1 dB where the maximum difference was 3.2 dB at 400 Hz in position (180°, 0°). The present study provides additional directivity data for seated talkers at 80 Hz, 100 Hz, 125 Hz, 10 kHz, 12.5 kHz and 20 kHz.
A comparison with the Monson et al. [16] measurements (of speech directivity at a normal vocal effort in octave bands from 125 Hz to 16 kHz) is made here by calculating the average of their results for male and female talkers to represent a unisex talker. The talkers in the Monson et al. study were standing; hence compared to the present study and Chu and Warnock there were no reflections from the lap (upper legs) of the talker. Four of the microphone positions used by Monson et al. were the same as the present study; these were (45°, 0°), (90°, 0°), (135°, 0°) and (180°, 0°). At these positions, the average difference between the directivity values from the present study and Monson et al. was 1.1 dB; with the maximum difference being 5.1 dB at 8 kHz in position (180°, 0°). Considering this comparison alongside that with seated talkers from Chu and Warnock, it is reasonable to assume that there are no major differences between seated and standing talkers for directivity in the horizontal plane that includes the mouth position.
3.4 Sound power
The estimated uncertainty in the sound power level due to spatial sampling is shown in Figure 13. For each talker, the uncertainty is < 1 dB at and below 1 kHz, and 1–2 dB between 1.25 kHz and 20 kHz. The levels of uncertainty between 1.25 kHz and 20 kHz are acceptable in the context of the large standard deviations that occur between individual sentences (refer back to Fig. 6). Above 10 kHz the uncertainty starts to decrease slightly due to changes in the spatial variation over microphone positions that were predominantly behind the talker.
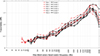 |
Figure 13. Estimated uncertainty in the measured sound power in one-third octave bands due to spatial sampling. |
To calculate the average sound power for male and female talkers, the normalisation correction that gave 60 dB LAeq at 1 m for the on-axis microphone is applied to the other 15 microphones. These normalised sound power levels in one-third octave bands for the six male and six female talkers are shown in Figure 14, and for average male and average female talkers in Figure 15. Note that at 63 Hz and 80 Hz there was measurable speech energy with male talkers but not female talkers. Male talkers had a 17.8 dB higher sound power level at 100 Hz (M = 62.7 dB, SE = 1.5 dB) and a 6.5 dB higher sound power level at 125 Hz (M = 63.2 dB, SE = 1.3 dB) than female talkers (100 Hz: M = 44.9 dB, SE = 2.7 dB and 125 Hz: M = 56.7 dB, SE = 4.4 dB) where t(10)=6.87, p < 0.01, r = 0.91 at 100 Hz and t(5.8)=3.93, p < 0.01, r = 0.85 at 125 Hz. At 800 Hz, male talkers had a 2.1 dB lower sound power level (M = 59.3 dB, SE = 0.4 dB) than female talkers (M = 61.4 dB, SE = 0.5 dB) where t(10)= − 3.300, p < 0.01, r = 0.72. One-third octave band sound power levels are tabulated in Table B.4, Appendix B.
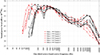 |
Figure 14. Sound power levels from the 12 talkers averaged over all sentences after normalisation so that the on-axis sound pressure level at 1 m from the mouth is 60 dB L Aeq. |
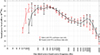 |
Figure 15. Sound power levels from the 12 talkers averaged over all sentences after normalisation so that the on-axis sound pressure level at 1 m from the mouth is 60 dB L Aeq: Averages are shown for male and female talkers with 95% confidence intervals. |
In octave bands, Figure 16 shows a comparison of the normalised sound power levels for male, female and unisex talkers for comparison with the unisex spectrum in ISO 3382-3 which has also been normalised to 60 dB LAeq. Octave band sound power data are given in Table B.5, Appendix B. (Note that for male talkers the 63 Hz octave band was the energetic sum of the 63 Hz and 80 Hz one-third octave bands because the 50 Hz one-third octave band was not measurable.) In the 125 Hz octave band, male talkers had a 5.0 dB lower sound power level (M = 67.2 dB, SE = 1.2 dB) than female talkers (M = 62.1 dB, SE = 2.3 dB) where t(10)=3.23, p < 0.01, r = 0.72. The ISO 3382-3 curve is within 2 dB of the unisex talker between 250 Hz and 2 kHz. However, ISO 3382-3 is lower than the unisex talker from the present study at 125 Hz, 4 kHz and 8 kHz by 4.4 dB, 4.3 dB and 10.7 dB respectively. ISO 3382-3 quotes the A-weighted sound power level of the unisex talker as 68.4 dB LW, A, which is within 0.3 dB of the calculated value given in Table B.5, Appendix B.
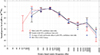 |
Figure 16. Average sound power in octave bands averaged over 720 sentences where the 16 microphones for each talker were normalised so that the on-axis sound pressure level at 1 m from the mouth is 60 dB L Aeq. Data are shown for male, female and the average of male and female talkers (where octave band data exists for both male and female talkers) which can be compared against the ISO 3382-3 data for the average of male and female talkers. |
3.5 Discussion
Two factors indicate that the sound pressure and sound power spectra in octave bands need re-consideration in ISO 3382-3. Firstly, ISO 3382-3 only contains an estimate for the 125 Hz octave band and secondly, ISO 3382-3 is calculated from the ANSI S3.5 ‘standard’ sound pressure spectrum which is significantly lower than average male and female talkers from the present study in the 4 kHz and 8 kHz octave bands.
In the absence of data for the 125 Hz octave band, ISO 3382-3 assumed that the on-axis SPL in the 125 Hz octave band was 6 dB lower than the 250 Hz octave band. The lowest one-third octave band that was measured by Pearsons et al. and Cushing et al. was 125 Hz; hence an estimate from their data for the 125 Hz octave band can be calculated by combining the 125 Hz and 160 Hz one-third octave bands. With this approach, normal vocal effort data from Pearsons et al. and Cushing et al. indicates that the 125 Hz octave band is lower than the 250 Hz octave band by 13.8 dB and 7.1 dB respectively for male talkers, and 6.2 dB and 11.6 dB respectively for female talkers. The inconsistency between the Pearsons et al. and Cushing et al. studies that used the same single 12-word sentence (and the fact that neither study normalised to a specified A-weighted level for different talkers before determining the average speech spectrum) suggests that a more robust approach is to use the unisex data from the present study. For the on-axis SPL, the present study indicates that the 125 Hz octave band is lower than the 250 Hz octave band by 0.0 dB for male talkers, 5.4 dB for female talkers and 2.0 dB for a unisex talker. From the present study, the resulting sound power level in the 125 Hz octave band for a unisex talker is 4.4 dB higher than ISO 3382-3.
In the 4 kHz and 8 kHz octave bands, the SPL spectrum in ISO 3382-3 is lower than the unisex spectrum from the present study by 3.6 dB and 9.9 dB respectively. Similarly, the sound power level spectrum in ISO 3382-3 is lower than the unisex spectrum from the present study by 4.3 dB and 10.7 dB respectively. The present study indicates that the high-frequency SPL spectrum is highly dependent on the speech material; however, both the 4 kHz and 8 kHz octave bands have lower values than the single 12-word sentence data from Pearsons et al. and Cushing et al. It is concluded that the sound power in the 4 kHz and 8 kHz octave bands in ISO 3382-3 (as well as the ‘standard’ unisex spectrum in ANSI S3.5 from which they are derived) are not representative of speech at a normal vocal effort level.
Comparing the 95% confidence intervals in one-third octave bands from 400 Hz to 4 kHz with those from 5 kHz to 16 kHz, it is seen that in this higher frequency range there are large differences between talkers and sentences due to the energy associated with . Future work could investigate differences between the isolated IEEE sentences and when they are combined to simulate continuous ‘conversational’ speech, perhaps including other languages too. In this situation, improved estimates of the on-axis SPL could be used to calculate the sound power using the directivity data from the present study.
The decision to use a male, female or unisex spectrum depends on the application. Differences between male and female talkers primarily occurred below the 160 Hz one-third octave band (also noted by Delaram et al. [18]). Above 4 kHz there are large inter-talker differences, but in the EHF range no significant differences were found between male and female talkers. Monson et al. [33] showed that female talkers had significantly higher SPLs (measured at 0.6 m on-axis) by 4.0–6.3 dB in one-third octave bands between 11 kHz and 20 kHz. This was for normal effort speech (20 six-syllable phrases) spoken by trained singers (predominantly aged under 30); hence it was acknowledged that further work was needed to assess any differences in a wider population. Delaram et al. [18] subsequently reported ≈4 dB higher SPLs for female talkers in the 8706 Hz ERB band at 1 m on-axis using 64 BKB sentences (elicited using a female talker’s audio recording of each sentence). Gender differences in the EHF frequency range were not found in the present study due to the wide range of SPLs from the 720 sentences (refer back to Fig. 7). Based on the present study, the definition of a one-third octave band spectrum for a unisex talker (on-axis SPL or sound power level) is reasonable between 160 Hz and 20 kHz. However, the definition of a unisex spectrum is perhaps easier to justify in octave bands because it results in a smoother spectrum and the only statistically significant difference (p < 0.01) between male and female talkers occurs in the 125 Hz octave band. The unisex octave band spectrum has similar levels of uncertainty in the 125 Hz, 8 kHz and 16 kHz octave bands. For the assessment of the acoustic quality of open-plan offices in ISO 3382-3 it is reasonable to assume a unisex talker. However, for speech privacy or speech security from a talker inside an enclosed space to a listener outside that space it will sometimes be appropriate to use the male spectrum to assess the worst-case scenario; this is due to the lowest sound insulation of a construction typically being in the low-frequency range. For speech intelligibility assessment using STI, it has been shown that incorporating a more realistic speech spectrum for male talkers [8] with less low-frequency and more high-frequency signal than the idealised IEC spectrum improves the accuracy of prediction with STI [34]. The present study, which uses the full set of IEEE sentences also shows that the level in the 8 kHz octave band in EN IEC 60268-16 is too low to represent male speech.
4 Conclusions
One-third octave band measurements of the on-axis SPL and the sound power level have been carried out with speech at a normal vocal effort using the 720 IEEE sentences. This has produced data for male talkers from 63 Hz to 20 kHz, and for female talkers from 100 Hz to 20 kHz. Comparison of the present study with previous studies shows that in one-third octave bands between 200 Hz and 3.15 kHz it is possible to get a reasonable estimate of the LTASS using speech material that ranges from a single sentence to over one minute of text. However, below 200 Hz and above 3.15 kHz there is a large variation between sentences.
For the on-axis SPLs and sound power levels in the low-frequency range (below 200 Hz), male talkers had higher levels than female talkers in the 100 Hz and 125 Hz one-third octave bands, and only male talkers had measurable levels in the 63 Hz and 80 Hz bands. In contrast to previous studies [4, 6] that used a single 12-word sentence as speech material, the present study used 720 sentences described as ‘phonetically balanced’. This gave average on-axis SPLs for female talkers in the 125 Hz and 160 Hz one-third octave bands that were respectively ≈7 dB and ≈16 dB higher than those in these previous studies. The low-frequency results indicate that gender-specific spectra are potentially useful when calculating ambient noise levels due to speech and also in speech security where the talker might be identifiable from the fundamental frequency. In the mid-frequency range (200 Hz–4 kHz), the only significant difference between male and female talkers was in the 800 Hz one-third octave band where females were ≈3 dB higher than males for the on-axis SPL and ≈2 dB higher for the sound power level. In the high-frequency range (5 kHz–20 kHz), there were no statistically significant differences between male and female talkers; although there were large differences between talkers and between sentences that did, and did not contain . In this high-frequency range, the on-axis SPLs from the present study are higher than those in the current ANSI S3.5, EN IEC 60268-16 and ISO 3382-3 Standards. The ANSI S3.5 ‘idealised’ spectrum in one-third octave bands has a −6 dB/octave slope from 500 Hz to 8 kHz whereas the present study indicates that a more suitable idealisation would be a frequency-independent level from 2 kHz to 10 kHz with a value equal to that at 2 kHz, followed by a −18 dB/octave slope from 10 kHz to 20 kHz.
For speech intelligibility and speech privacy assessments, it is reasonable to average male and female talkers to give a unisex talker based on octave bands. This study quantified the sound power level in the 63 Hz octave band for male talkers and showed that male talkers had a 5 dB higher level than female talkers in the 125 Hz octave band. In the 4 kHz and 8 kHz octave bands, the sound power level for a unisex talker from the present study is higher than in the current ISO 3382-3.
Conflicts of interest
The authors declare that they have no conflicts of interest in relation to this article.
Data availability statement
Tabulated data associated with this article are provided in Appendix B of this article.
Author contribution statement
Carl Hopkins: Conceptualization, Methodology, Software, Validation, Formal analysis, Investigation, Resources, Writing – Original Draft, Writing – Review & Editing, Visualization, Supervision, Project administration. Simone Graetzer: Methodology, Software, Validation, Formal analysis, Investigation, Writing – Original Draft, Writing – Review & Editing. Gary Seiffert: Methodology, Investigation, Resources.
Ethics approval
This study was approved by the Ethics Committee of The University of Liverpool. Informed consent was obtained from all individual participants included in the study.
References
- A. Haapakangas, V. Hongisto, M. Eerola, T. Kuusisto: Distraction distance and perceived disturbance by noise – An analysis of 21 open-plan offices. The Journal of the Acoustical Society of America 141, 1 (2017) 127–136. [Google Scholar]
- ASTM E2638-10: Standard test method for objective measurement of the speech privacy provided by a closed room. ASTM International, 2017. [Google Scholar]
- M. Robinson, C. Hopkins, K. Worrall, T. Jackson: Thresholds of information leakage for speech security outside meeting rooms. The Journal of the Acoustical Society of America 136, 3 (2014) 1149–1159. [Google Scholar]
- K.S. Pearsons, R.L. Bennett, S.A. Fidell: Speech levels in various noise environments. Office of Health and Ecological Effects, Office of Research and Development, US EPA, 1977. [Google Scholar]
- W.O. Olsen: Average speech levels and spectra in various speaking/listening conditions. American Journal of Audiology 7, 2 (1998) 21–25. [CrossRef] [PubMed] [Google Scholar]
- I.R. Cushing, F.F. Li, T.J. Cox, K. Worrall, T. Jackson: Vocal effort levels in anechoic conditions. Applied Acoustics 72, 9 (2011) 695–701. [Google Scholar]
- D. Byrne, H. Dillon, K. Tran, S. Arlinger, K. Wilbraham, R. Cox, B. Hagerman, R. Hetu, J. Kei, C. Lui, J. Kiessling, M.N. Kotby, N.H.A. Nasser, W.A.H. El Kholy, Y. Nakanishi, H. Oyer, R. Powell, D. Stephens, R. Meredith, T. Sirimanna, G. Tavartkiladze, G.I. Frolenkov, S. Westerman, C. Ludvigsen: An international comparison of long-term average speech spectra. The Journal of the Acoustical Society of America 96, 4 (1994) 2108–2120. [Google Scholar]
- L. Morales, G. Leembruggen, S. Dance, B.M. Shield: A revised speech spectrum for STI calculations. Applied Acoustics 132 (2018) 33–42. [Google Scholar]
- EN 60268-16:2011: Sound system equipment – Part 16: objective rating of speech intelligibility by speech transmission index. European Committee for Electrotechnical Standardization, 2011. [Google Scholar]
- Institute of Electrical and Electronics Engineers: IEEE recommended practice for speech quality measurements. IEEE Transactions on Audio and Electroacoustics 17, 3 (1969) 227–246. [Google Scholar]
- B.B. Monson, E.J. Hunter, A.J. Lotto, B.H. Story: The perceptual significance of high-frequency energy in the human voice. Frontiers in Psychology 5 (2014) 587. [PubMed] [Google Scholar]
- B.B. Monson, J. Caravello: The maximum audible low-pass cutoff frequency for speech. The Journal of the Acoustical Society of America 146, 6 (2019) EL496–EL501. [Google Scholar]
- L.L. Hunter, B.B. Monson, D.R. Moore, S. Dhar, B.A. Wright, K.J. Munro, L.M. Zadeh, C.M. Blankenship, S.M. Stiepan, J.H. Siegel: Extended high frequency hearing and speech perception implications in adults and children. Hearing Research 397 (2020) 107922. [Google Scholar]
- E. Jacewicz, J.M. Alexander, R.A. Fox: Introduction to the special issue on perception and production of sounds in the high-frequency range of human speech. The Journal of the Acoustical Society of America 154, 5 (2023) 3168–3172. [Google Scholar]
- B.C. Moore, M.A. Stone, C. Füllgrabe, B.R. Glasberg, S. Puria: Spectro-temporal characteristics of speech at high frequencies, and the potential for restoration of audibility to people with mild-to-moderate hearing loss. Ear and Hearing 29, 6 (2008) 907–922. [Google Scholar]
- B.B. Monson, E.J. Hunter, B.H. Story: Horizontal directivity of low-and high-frequency energy in speech and singing. The Journal of the Acoustical Society of America 132, 1 (2012) 433–441. [Google Scholar]
- M.K. Miller, V. Delaram, A. Trine, R.M. Ananthanarayana, E. Buss, B.B. Monson, G.C. Stecker: An anechoic, high-fidelity, multidirectional speech corpus. Journal of Speech, Language, and Hearing Research 68, 1 (2025) 411–418. [Google Scholar]
- V. Delaram, M.K. Miller, R.M. Ananthanarayana, A. Trine, E. Buss, G.C. Stecker, B.B. Monson: Gender and speech material effects on the long-term average speech spectrum, including at extended high frequencies. The Journal of the Acoustical Society of America 156, 5 (2024) 3056–3066. [Google Scholar]
- W.T. Chu, A.C.C. Warnock: Detailed directivity of sound fields around human talkers. IRC Research Report 104, National Research Council Canada, Ottawa, Canada, 2002. [Google Scholar]
- ISO 3382-3:2022: Acoustics – Measurement of room acoustic parameters – Part 3: open plan offices. International Organisation for Standardisation, 2022. [Google Scholar]
- EN IEC 60268-16:2020: Sound system equipment – Part 16: objective rating of speech intelligibility by speech transmission index. European Committee for Electrotechnical Standardization, 2020. [Google Scholar]
- ANSI S3.5-1997: Methods for calculation of the speech intelligibility index. American National Standards Institute, 1997. [Google Scholar]
- https://www.fon.hum.uva.nl/praat/manual/Sound_To_Pitch___.html (accessed 6th April 2025). [Google Scholar]
- C. Pörschmann, J.M. Arend: Investigating phoneme-dependencies of spherical voice directivity patterns. The Journal of the Acoustical Society of America 149 (2021) 4553–4564. [Google Scholar]
- C. Pörschmann, J.M. Arend: Phoneme dependence of horizontal asymmetries in voice directivity. JASA Express Letters 4, 2 (2024) 025205. [Google Scholar]
- ISO 3745:2012+A1:2017: Acoustics – Determination of sound power levels and sound energy levels of noise sources using sound pressure – Precision methods for anechoic rooms and hemi-anechoic rooms. International Organisation for Standardisation, 2017. [Google Scholar]
- C.M. Johns-Lewis: Prosodic differentiation of discourse modes, in: Intonation in Discourse. Routledge, 2018, pp. 199–220. [Google Scholar]
- D. Graddol: Discourse specific pitch behaviour, in: Intonation in Discourse. Routledge, 2018, pp. 221–238. [Google Scholar]
- ISO 9921:2003: Ergonomics – Assessment of speech communication. International Organisation for Standardisation, 2003. [Google Scholar]
- P.C. Loizou: Speech Enhancement: Theory and Practice. CRC Press, 2007. [Google Scholar]
- C. Pörschmann: Supplementary material for “A database for the comparison of measured datasets of human voice directivity”, in: Forum Acusticum 2023, 2023. https://doi.org/10.5281/zenodo.7834211. [Google Scholar]
- J. Sundberg: Chest wall vibrations in singers. Journal of Speech, Language, and Hearing Research 26, 3 (1983) 329–340. [Google Scholar]
- B.B. Monson, A.J. Lotto, B.H. Story: Analysis of high-frequency energy in long-term average spectra of singing, speech, and voiceless fricatives. The Journal of the Acoustical Society of America 132, 3 (2012) 1754–1764. [Google Scholar]
- L. Morales, F.F. Li: A new verification of the speech transmission index for the English language. Speech Communication 105 (2018) 1–11. [Google Scholar]
- J.V. Tobias: Relative occurrence of phonemes in American English. The Journal of the Acoustical Society of America 31, 5 (1959) 631–631. [Google Scholar]
Appendix A
Phonetic content of the IEEE sentences
An assessment has been made of the broad phonetic content of the IEEE sentences based on the approach used by Delaram et al. [18] to calculate phoneme densities for American pronunciation. Broad phonetic transcriptions of the IEEE sentences for British English were made using ToPhonetics.com. British English IPA symbol categories were based on International Phonetic Alphabet classifications and the Oxford English Dictionary. An approximant class was defined with members comprising the glides of Delaram et al. where ‘r’ represents /ɹ/ plus the lateral /l/. Diacritics and modifiers were not counted as separate phones. The vowel set included all those used by ToPhonetics.com and differed from those in Delaram et al. and those listed here according to the English variety. Using a custom MATLAB script the frequency of occurrence was counted for each phone type and phonetic class across each list and across the 720 sentences. For each phone type and phonetic class, the broad phonetic [sic] density was calculated as the total number of phones of that type or class divided by the total number of phones and reported as a percentage. For the full set of 720 IEEE sentences, Table A.1 shows the percentages at the individual (broad) phone level. In the full set of 720 sentences, there are only 65, 35, 26 and 8 instances of the vowels /eə/, /ə/, /ɔ/ and /ʊə/ respectively, and just one instance of // as this typically has a very low occurrence (e.g. see [35]). Table A.2 shows the total number of phones alongside the percentage of phones in each phonetic class. For the classes of sibilant fricatives, non-sibilant fricatives, affricates, nasals, approximants, vowels, each of the 72 lists has percentages that are within ≈5% of the value for all 720 sentences, although for the class of stops they are within ≈8%.
Phone counts and phonetic densities at the individual (broad) phone level for the full set of 720 IEEE sentences.
Phone counts and phonetic densities in each phonetic class for the full set of 720 IEEE sentences, and comparisons with individual lists.
Appendix B
Tabulated data for male, female and unisex talkers
One-third octave band sound pressure levels for speech on-axis at 1 m from the mouth when normalised to 60 dBA.
Octave band sound pressure levels for speech on-axis at 1 m from the mouth when normalised to 60 dBA.
One-third octave band directivity with sound pressure levels normalised to the on-axis microphone – Unisex (average of male and female talkers).
One-third octave band sound power levels for speech after normalisation so that the on-axis sound pressure level at 1 m from the mouth is 60 dBA.
Octave band sound power levels for speech after normalisation so that the on-axis sound pressure level at 1 m from the mouth is 60 dBA.
Cite this article as: Hopkins C. Graetzer S. & Seiffert G. 2026. Sound power of speech between 63 Hz and 20 kHz at a normal vocal effort level. Acta Acustica, 10, 63. https://doi.org/10.1051/aacus/2026053.
All Tables
Phone counts and phonetic densities at the individual (broad) phone level for the full set of 720 IEEE sentences.
Phone counts and phonetic densities in each phonetic class for the full set of 720 IEEE sentences, and comparisons with individual lists.
One-third octave band sound pressure levels for speech on-axis at 1 m from the mouth when normalised to 60 dBA.
Octave band sound pressure levels for speech on-axis at 1 m from the mouth when normalised to 60 dBA.
One-third octave band directivity with sound pressure levels normalised to the on-axis microphone – Unisex (average of male and female talkers).
One-third octave band sound power levels for speech after normalisation so that the on-axis sound pressure level at 1 m from the mouth is 60 dBA.
Octave band sound power levels for speech after normalisation so that the on-axis sound pressure level at 1 m from the mouth is 60 dBA.
All Figures
|
Figure 1. Sketch of the measurement surface around the talker. The black arrow indicates the origin of the sphere (mouth position) and the direction that the talker was facing. Circular markers indicate the sampling positions; the large black marker indicates the on-axis microphone, red markers indicate the other 15 microphones, and green markers indicate the positions where it was assumed that the signal was identical to the red marker on the opposite side of the sphere. |
| In the text | |
|
Figure 2. Sound pressure level in one-third octave bands at 1 m on-axis from the six male and six female talkers averaged over all sentences. |
| In the text | |
|
Figure 3. Sound pressure level in one-third octave bands at 1 m on-axis (after normalisation of each sentence to 60 dB L Aeq) from the six male talkers and six female talkers averaged over all sentences. |
| In the text | |
|
Figure 4. Sound pressure level in one-third octave bands at 1 m on-axis (after normalisation of each sentence to 60 dB L Aeq) in terms of the mean with 95% confidence intervals from the six male talkers and six female talkers averaged over all sentences. |
| In the text | |
|
Figure 5. Sound pressure level in one-third octave bands at 1 m on-axis (after normalisation of each sentence to 60 dB L Aeq) from the six male and six female talkers averaged over all sentences and spectra quoted in Standards and previous studies. |
| In the text | |
|
Figure 6. Standard deviation of the sound pressure level in one-third octave bands at 1 m on-axis (after normalisation of each sentence to 60 dB L Aeq) from the six male talkers and six female talkers for (a) all sentences (shown with dashed lines) and (b) for all lists (shown with solid lines). |
| In the text | |
|
Figure 7. Range of the sound pressure level in one-third octave bands at 1 m on-axis (after normalisation of each sentence to 60 dB L Aeq) from the six male talkers and six female talkers for (a) all sentences (shown with dashed lines) and (b) for all lists (shown with solid lines). |
| In the text | |
|
Figure 8. Sound pressure level in one-third octave bands at 1 m on-axis (after normalisation of each sentence to 60 dB L Aeq) for all individual sentences from the six male talkers (upper graph) and the six female talkers (lower graph). For each talker, the IEEE sentences are shown in black with the 12 sentences which do not contain shown in magenta. |
| In the text | |
|
Figure 9. Sound pressure level in one-third octave bands at 1 m on-axis (after normalisation of each sentence to 60 dB L Aeq) in terms of the mean with 95% confidence intervals from the six male talkers and six female talkers averaged over (a) all 720 sentences (lines without markers) and (b) the 12 sentences that do not contain (lines with circular markers). |
| In the text | |
|
Figure 10. Sound pressure level in octave bands at 1 m on-axis (after normalisation of each sentence to 60 dB L Aeq) from the six male and six female talkers averaged over all sentences for comparison with male and female spectra quoted in Standards and previous studies. |
| In the text | |
|
Figure 11. Sound pressure level in octave bands at 1 m on-axis (after normalisation of each sentence to 60 dB L Aeq) for a unisex talker averaged over all sentences for comparison with unisex spectra quoted in Standards. |
| In the text | |
|
Figure 12. Sound pressure level in one-third octave bands from all 16 microphones normalised to the frontal, on-axis microphone for unisex talkers averaged over all sentences with 95% confidence intervals: male talkers (upper), female talkers (middle) and unisex (lower). Legends indicate microphone positions in terms of (azimuth angle, elevation angle). |
| In the text | |
|
Figure 13. Estimated uncertainty in the measured sound power in one-third octave bands due to spatial sampling. |
| In the text | |
|
Figure 14. Sound power levels from the 12 talkers averaged over all sentences after normalisation so that the on-axis sound pressure level at 1 m from the mouth is 60 dB L Aeq. |
| In the text | |
|
Figure 15. Sound power levels from the 12 talkers averaged over all sentences after normalisation so that the on-axis sound pressure level at 1 m from the mouth is 60 dB L Aeq: Averages are shown for male and female talkers with 95% confidence intervals. |
| In the text | |
|
Figure 16. Average sound power in octave bands averaged over 720 sentences where the 16 microphones for each talker were normalised so that the on-axis sound pressure level at 1 m from the mouth is 60 dB L Aeq. Data are shown for male, female and the average of male and female talkers (where octave band data exists for both male and female talkers) which can be compared against the ISO 3382-3 data for the average of male and female talkers. |
| In the text | |
Current usage metrics show cumulative count of Article Views (full-text article views including HTML views, PDF and ePub downloads, according to the available data) and Abstracts Views on Vision4Press platform.
Data correspond to usage on the plateform after 2015. The current usage metrics is available 48-96 hours after online publication and is updated daily on week days.
Initial download of the metrics may take a while.