Figure 3.
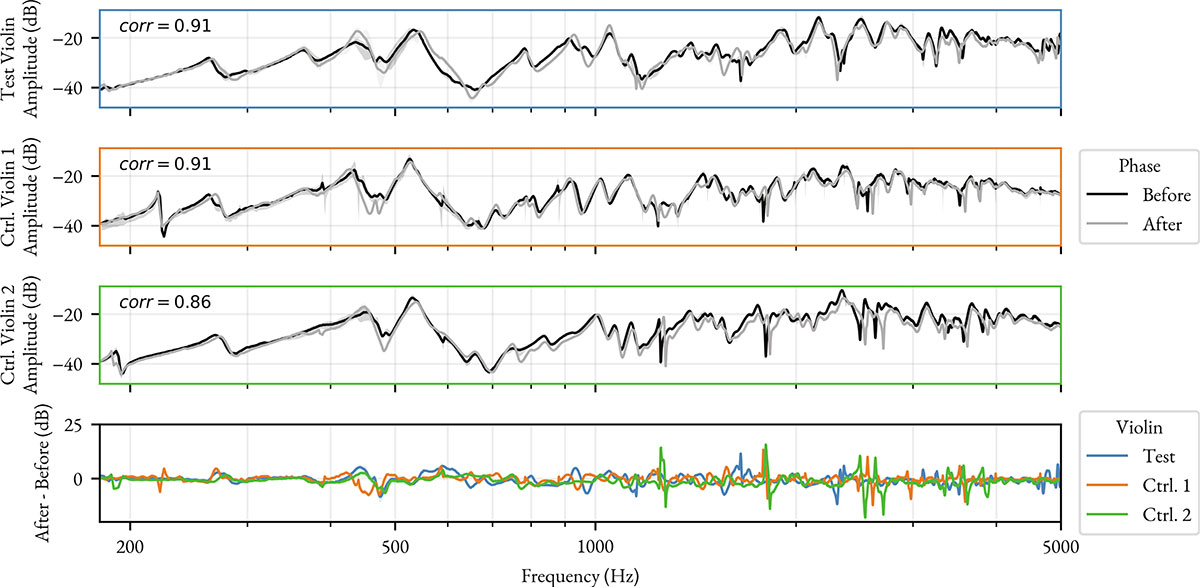
Download original image
Input admittance measured at the bridge for the Test Violin and the two Control Violins. Black curves indicate the “Before” phase and gray curves indicate the “After” phase; the Pearson correlation coefficient between these two states is provided in the top-left corner of each panel. The bottom panel displays the magnitude difference between the “Before” and the “After” phases for each instrument. Shaded areas represent the measurement uncertainty (minimum and maximum values over 3 repetitions).
Current usage metrics show cumulative count of Article Views (full-text article views including HTML views, PDF and ePub downloads, according to the available data) and Abstracts Views on Vision4Press platform.
Data correspond to usage on the plateform after 2015. The current usage metrics is available 48-96 hours after online publication and is updated daily on week days.
Initial download of the metrics may take a while.