Figure 4.
Download original image
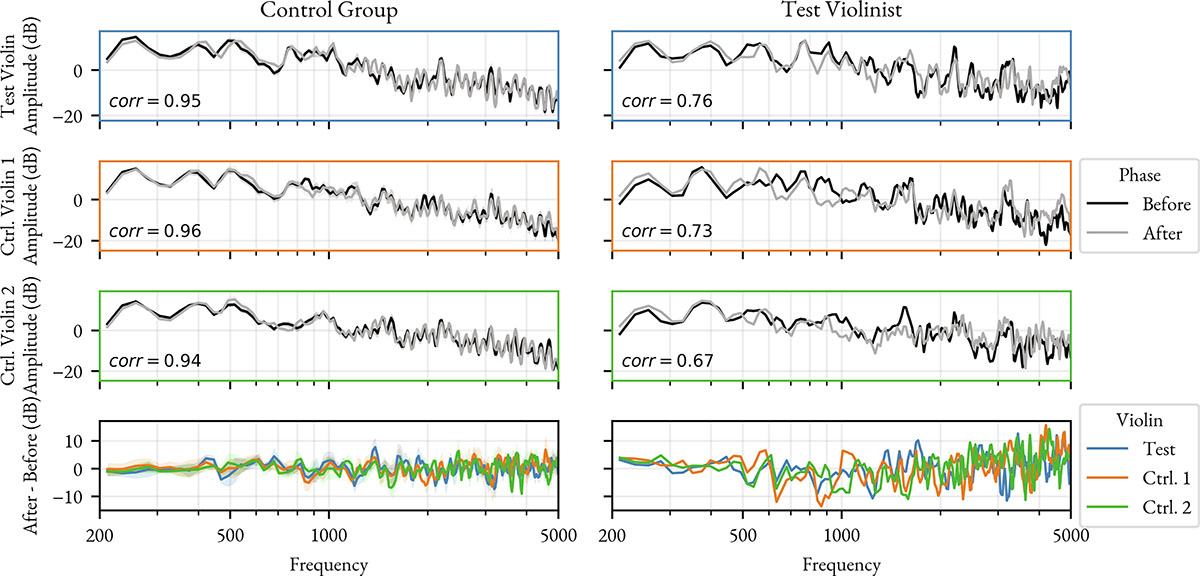
Long-Term Average Spectra (LTAS) of scales recorded on the Test Violin and the two Control Violins. The left column displays the average across the Control Group (10 violinists), while the right column displays the Test Violinist. Black curves indicate the “Before” phase and gray curves indicate the “After” phase; the Pearson correlation coefficient between these two states is provided in the bottom-left corner of each panel. The bottom panel displays the mean LTAS magnitude difference between the “Before” and the “After” phases. For the Control Group, shaded areas represent the 95% confidence interval.
Current usage metrics show cumulative count of Article Views (full-text article views including HTML views, PDF and ePub downloads, according to the available data) and Abstracts Views on Vision4Press platform.
Data correspond to usage on the plateform after 2015. The current usage metrics is available 48-96 hours after online publication and is updated daily on week days.
Initial download of the metrics may take a while.