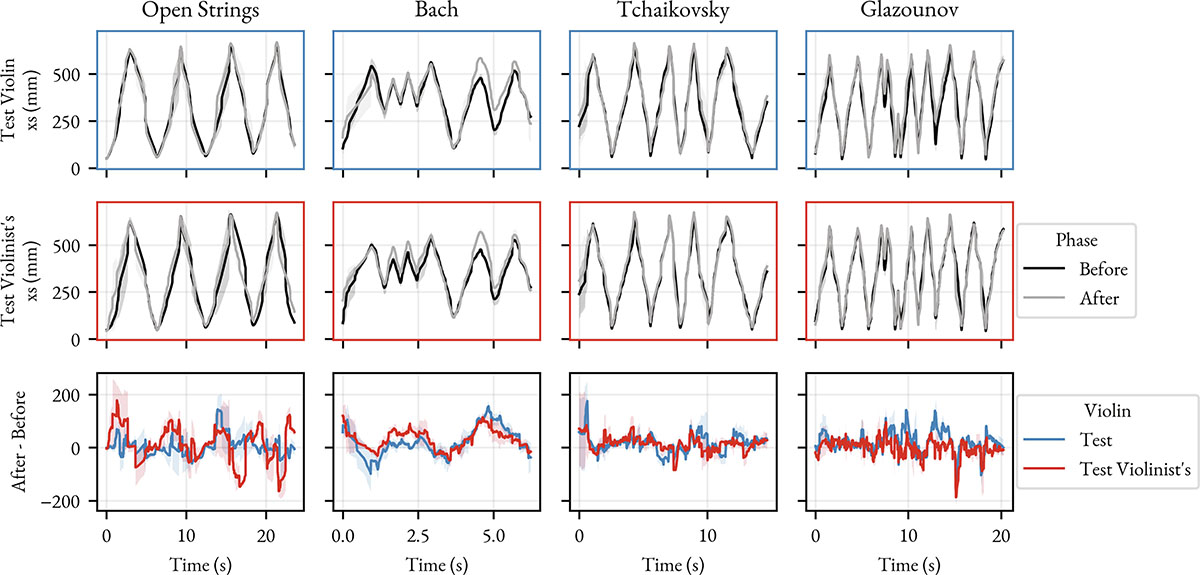
Figure 5.
Download original image
Aligned bow position profiles (xs) recorded on the Test Violin and the Test Violinist’s Personal Violin, during playing by the Test Violinist. Columns correspond to distinct musical excerpts. Black curves denote the “Before” phase and gray curves denote the “After” phase. The bottom panel displays the mean bow position difference between the “After” and the “Before” phases. Shaded bands indicate the 95% confidence interval across repeated takes (N = 3 for the “Before” phase, N = 2 for the “After” phase).
Current usage metrics show cumulative count of Article Views (full-text article views including HTML views, PDF and ePub downloads, according to the available data) and Abstracts Views on Vision4Press platform.
Data correspond to usage on the plateform after 2015. The current usage metrics is available 48-96 hours after online publication and is updated daily on week days.
Initial download of the metrics may take a while.