Figure C1
Download original image
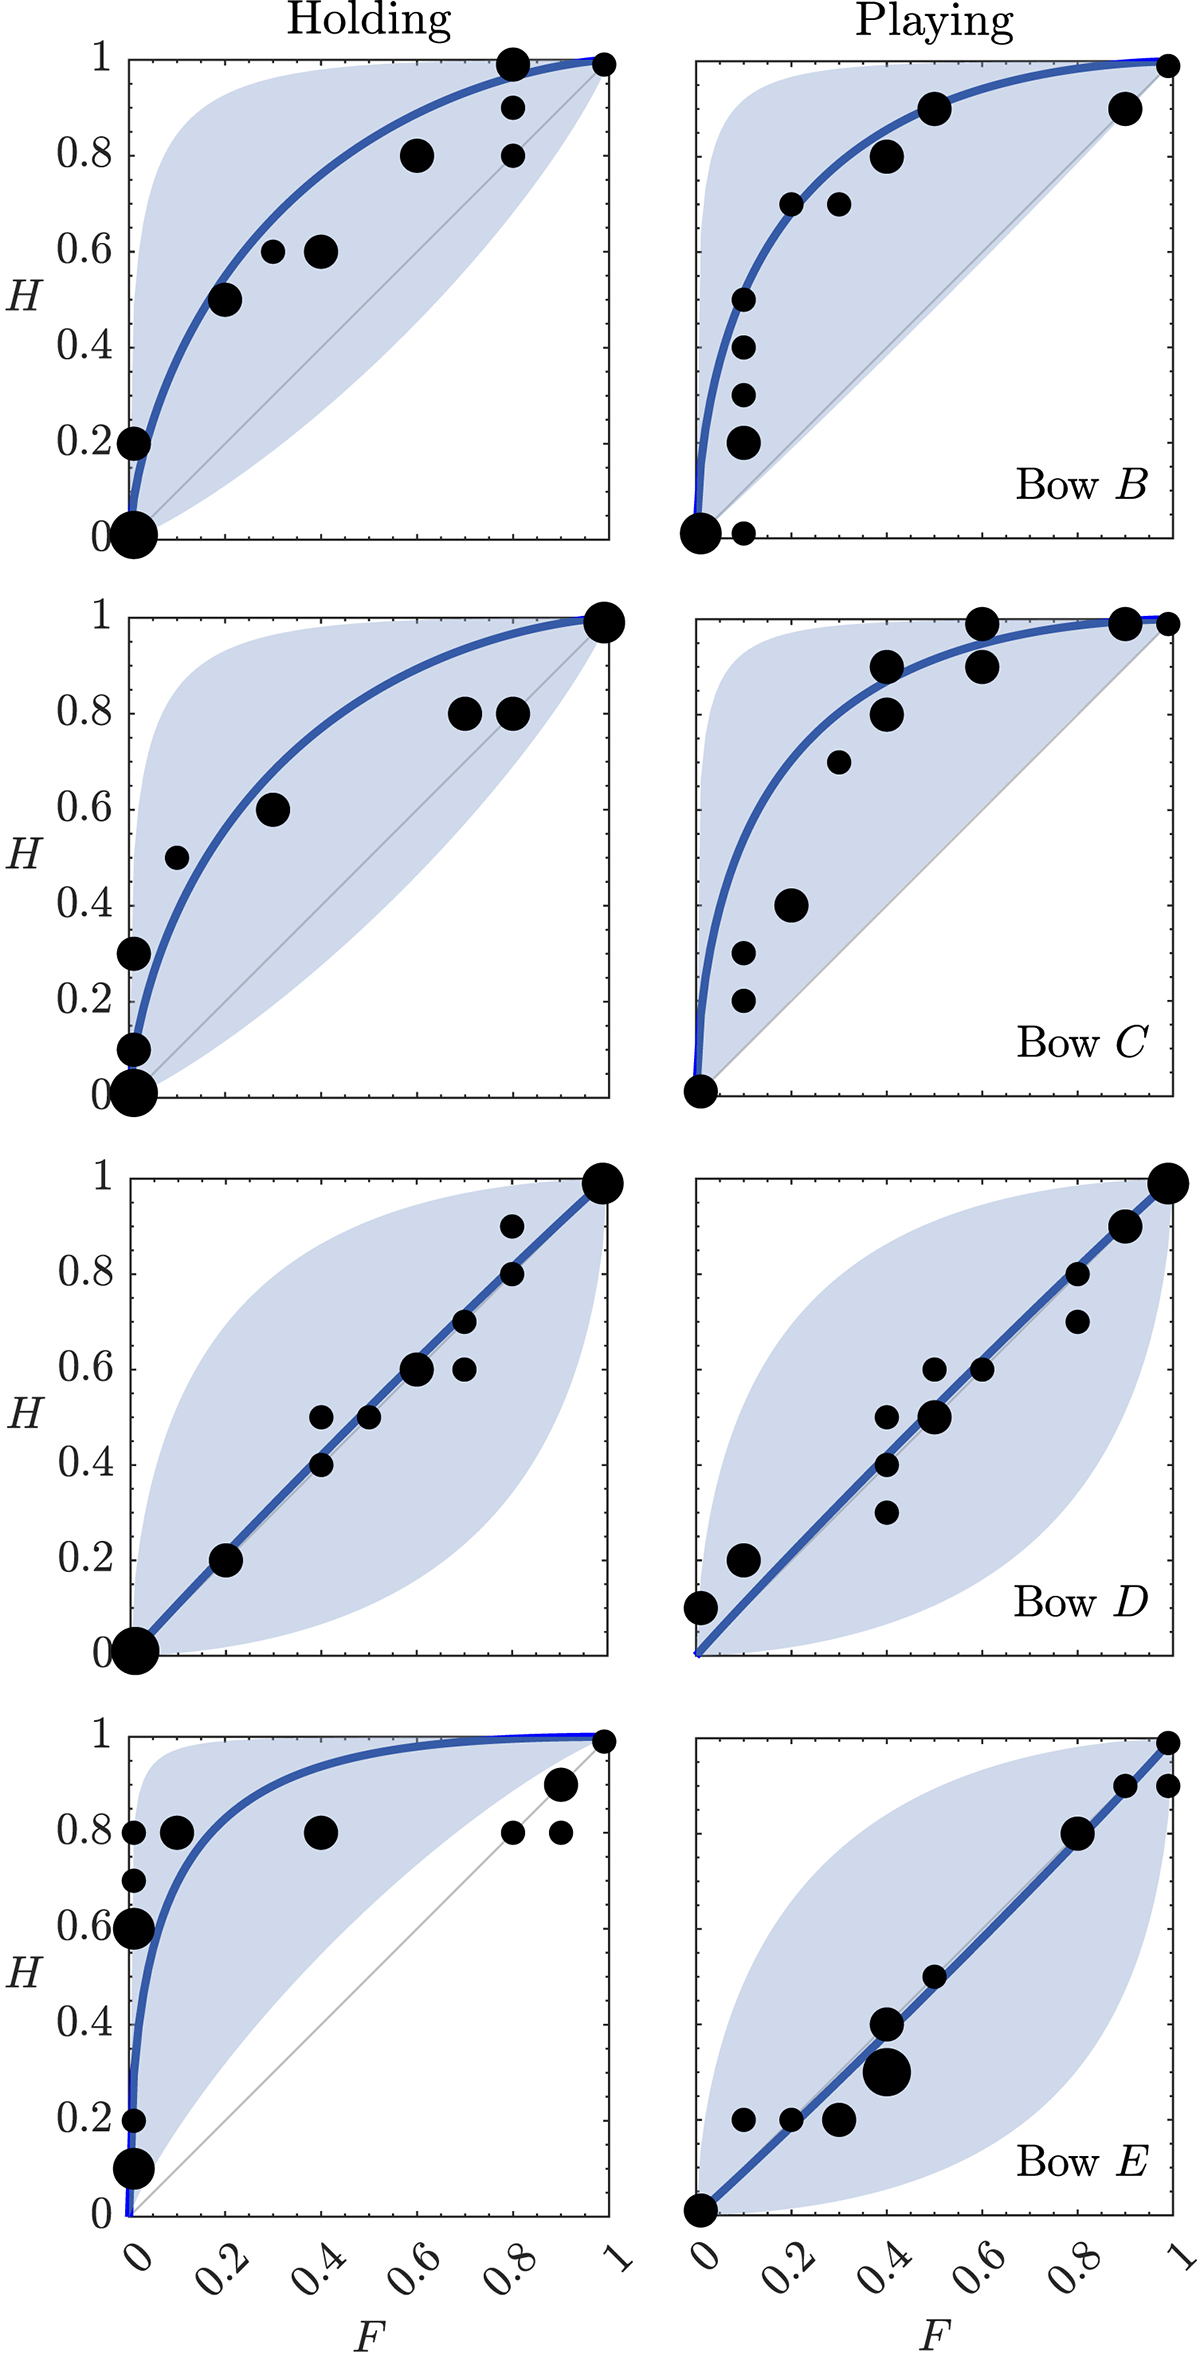
Experimental ROC points and theoretical ROC curves (in blue) for the Paris discrimination tests. Holding test on the left, playing test on the right. From top to bottom: bows B, C, D and E. The 95% confidence interval for the theoretical curve is represented as a blue filling.
Current usage metrics show cumulative count of Article Views (full-text article views including HTML views, PDF and ePub downloads, according to the available data) and Abstracts Views on Vision4Press platform.
Data correspond to usage on the plateform after 2015. The current usage metrics is available 48-96 hours after online publication and is updated daily on week days.
Initial download of the metrics may take a while.