Open Access
Figure 11.
Download original image
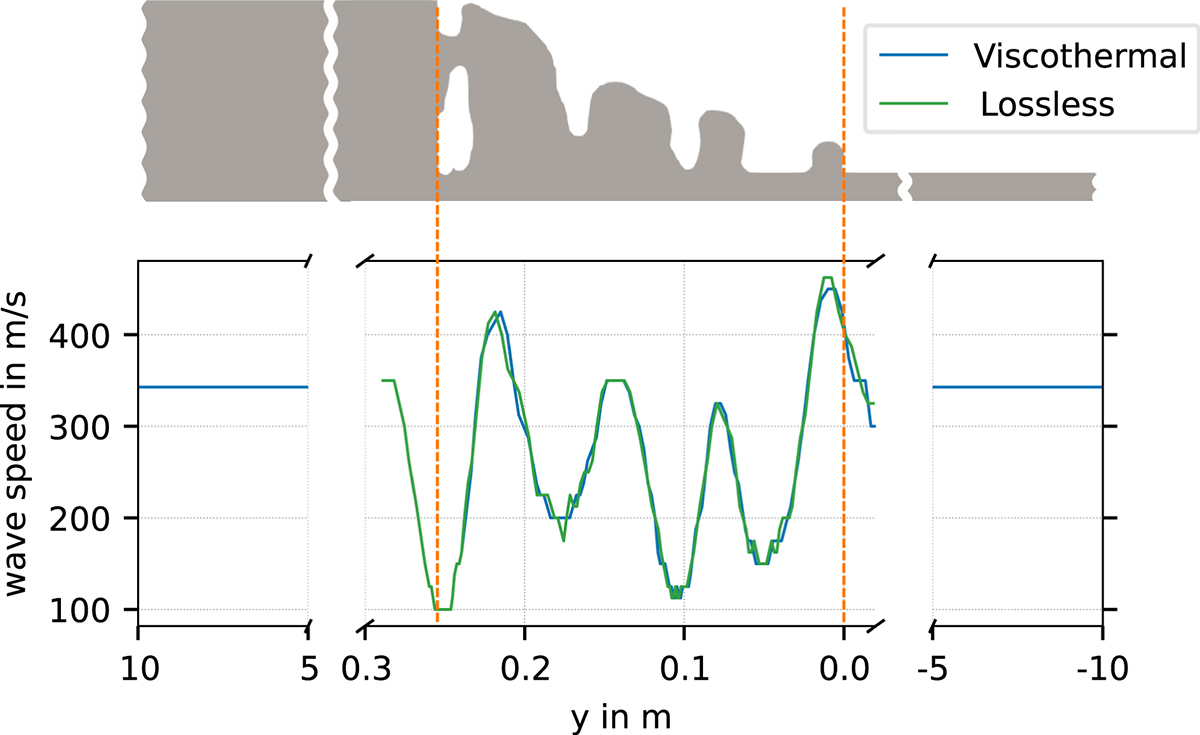
MAC value along the y-axis. A measure of similarity among the excitation signal and the time history pressure signals along the input channel, SBH and output channel. The pink region depicts inside the SBH.
Current usage metrics show cumulative count of Article Views (full-text article views including HTML views, PDF and ePub downloads, according to the available data) and Abstracts Views on Vision4Press platform.
Data correspond to usage on the plateform after 2015. The current usage metrics is available 48-96 hours after online publication and is updated daily on week days.
Initial download of the metrics may take a while.