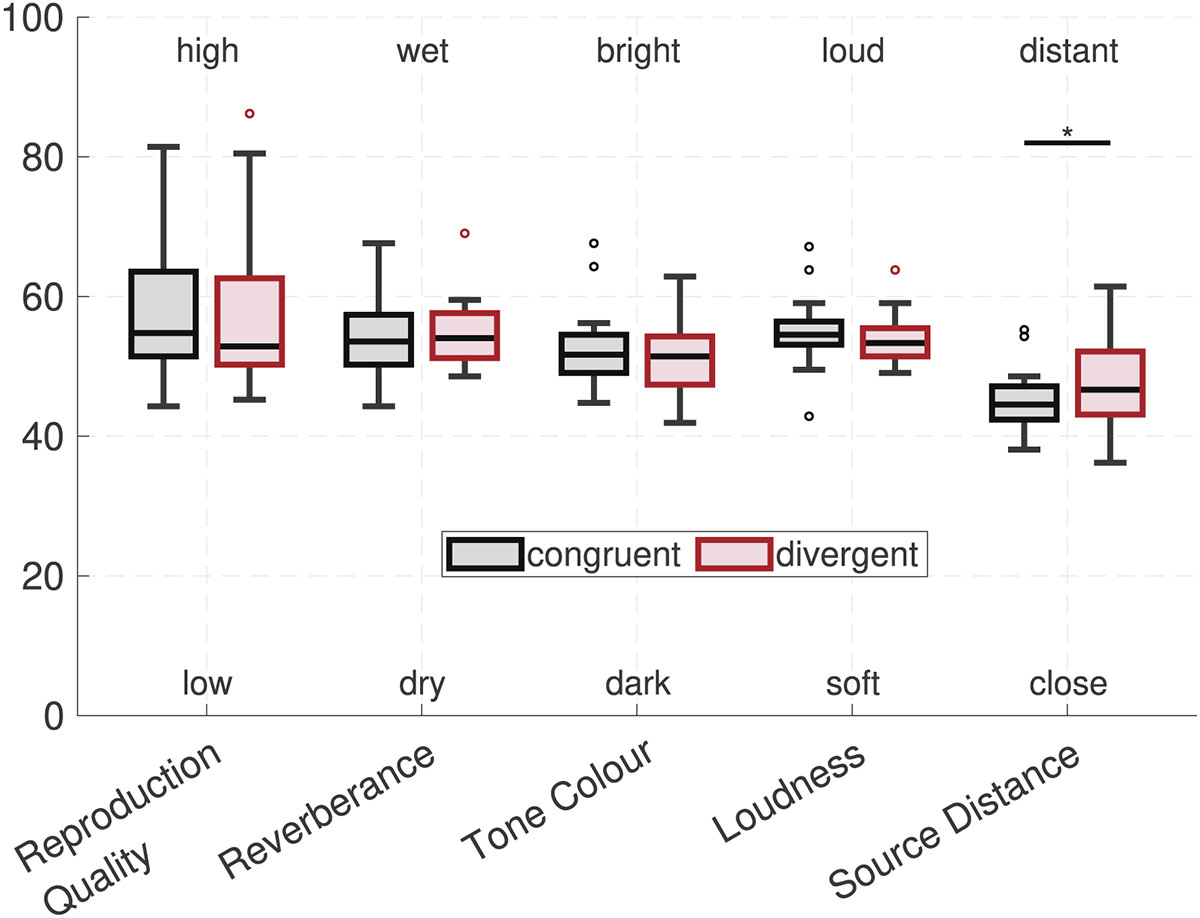
Figure 6.
Download original image
Box plots illustrating the ratings averaged over three repetitions for each room-acoustic attribute. Each box plot represents ratings from all participants (N = 20) across all BRIR sets (7 conditions) for the given attribute. Within each attribute, the left black box plot corresponds to the congruent playback room, and the right red box plot corresponds to the divergent playback room.
Current usage metrics show cumulative count of Article Views (full-text article views including HTML views, PDF and ePub downloads, according to the available data) and Abstracts Views on Vision4Press platform.
Data correspond to usage on the plateform after 2015. The current usage metrics is available 48-96 hours after online publication and is updated daily on week days.
Initial download of the metrics may take a while.