Open Access
Figure 7.
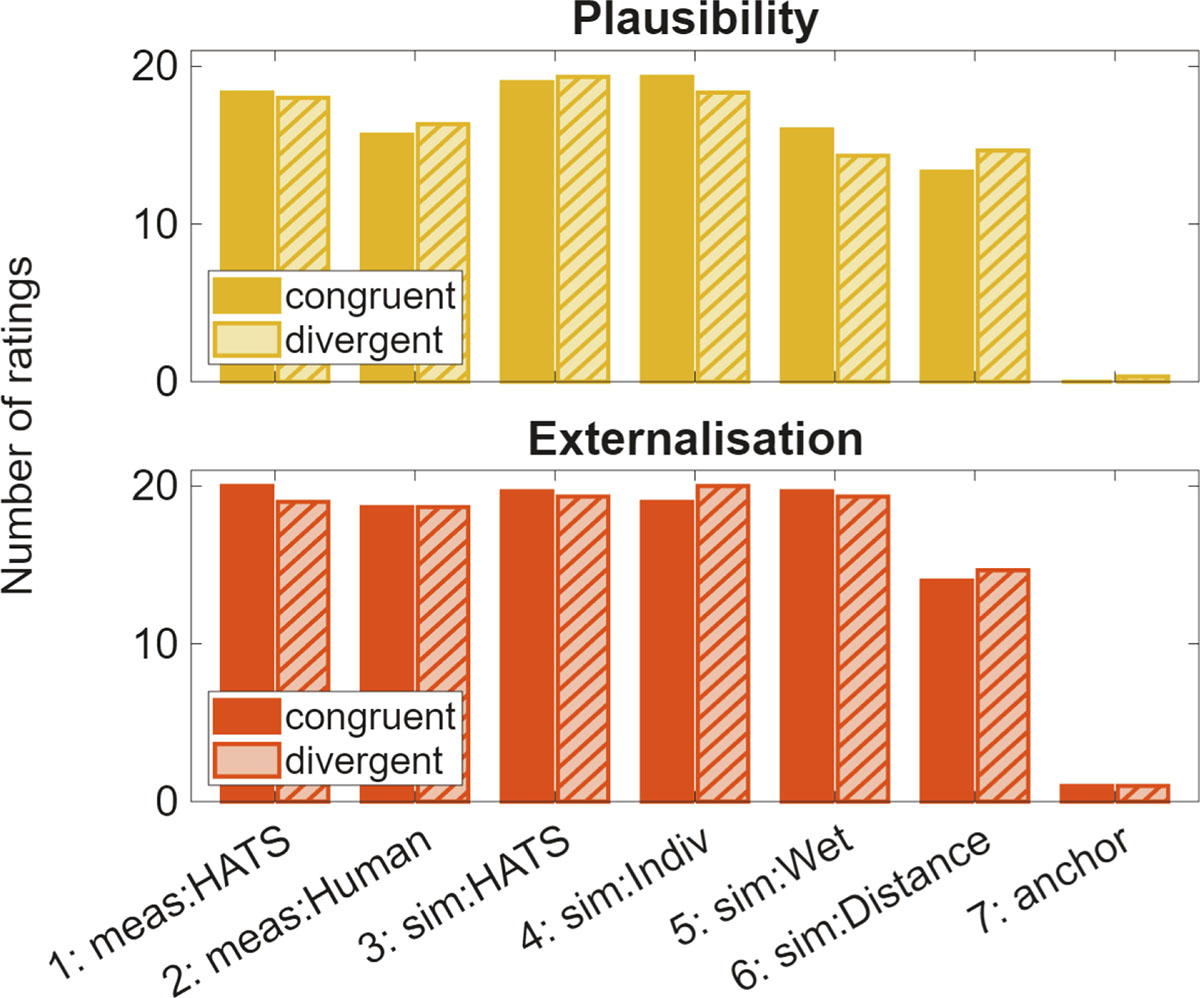
Download original image
Plausibility and externalisation ratings as a function of BRIR sets. Each pair of bar plots represents the ratings for both rooms, with the left, unfilled bar always representing the congruent playback room and the striped bar representing the divergent playback room.
Current usage metrics show cumulative count of Article Views (full-text article views including HTML views, PDF and ePub downloads, according to the available data) and Abstracts Views on Vision4Press platform.
Data correspond to usage on the plateform after 2015. The current usage metrics is available 48-96 hours after online publication and is updated daily on week days.
Initial download of the metrics may take a while.