| Issue |
Acta Acust.
Volume 10, 2026
|
|
|---|---|---|
| Article Number | 33 | |
| Number of page(s) | 19 | |
| Section | Musical Acoustics | |
| DOI | https://doi.org/10.1051/aacus/2026026 | |
| Published online | 05 May 2026 | |
Scientific Article
Timbral determinants of the Karadeniz kemenche: a multimodal analysis of material and geometric influences
1
Vibration and Acoustics Laboratory, Alanya Alaaddin Keykubat University, Antalya 07425, Türkiye
2
Department of Mechanical Engineering, Alanya Alaaddin Keykubat University, Antalya 07425, Türkiye
3
Department of Industrial Engineering, Alanya Alaaddin Keykubat University, Antalya 07425, Türkiye
4
Department of Musicology, İstanbul University, İstanbul 34848, Türkiye
* Corresponding author: This email address is being protected from spambots. You need JavaScript enabled to view it.
Received:
1
September
2025
Accepted:
11
March
2026
Abstract
The Karadeniz kemenche, a traditional bowed lute from Turkey’s Black Sea region, exhibits distinct structural adaptations that shape its acoustic signature across musical repertoires. This study integrates experimental modal analysis, cluster statistics, and regression modelling to investigate how material and geometric parameters relate to the instrument’s sound production. Through testing of 18 regionally representative samples, a binary classification was identified: bass-oriented instruments (n = 11) predominantly use ivy/plum with thicker soundboards (0.31 ± 0.02 cm), while treble-oriented designs (n = 7) employ dense mulberry with thinner soundboards (0.25 ± 0.01 cm). Higher Mode 7 frequencies (867 ± 18 Hz, associated with neck-scroll vibrations) correlate with greater high-frequency spectral content in treble-oriented instruments. Cluster analysis confirms this division (Gap statistic = 0.82), with spectral energy variance explaining 79% of group differences (PERMANOVA, p = 0.002). Regression models quantify key predictors, revealing fingerboard/nut thickness as the most influential variable (13.22% effect) and validating material choices through large effect sizes (η2 = 0.58 for woods). Mode 1 frequency (∼60 Hz) serves as a structural indicator reflecting body stiffness, though the two-octave gap from playing frequencies (200–330 Hz) precludes direct resonant enhancement. The findings reveal correlations between regional music traditions and instrument construction parameters. Methodologically, this work advances heritage instrument analysis by combining vibrational testing with predictive modelling, offering a transferable framework for studying material-structure-sound relationships in other folk instruments. For luthiers, the results provide evidence-based design guidelines, while acousticians gain insights into how craftsmanship traditions correlate with modal energy distribution. Two transitional samples with hybrid properties suggest a design continuum worthy of further exploration.
Key words: Kemenche acoustics / Structural-acoustic relationships / Experimental modal analysis / Regression modelling / Material acoustics
© The Author(s), Published by EDP Sciences, 2026
 This is an Open Access article distributed under the terms of the Creative Commons Attribution License (https://creativecommons.org/licenses/by/4.0), which permits unrestricted use, distribution, and reproduction in any medium, provided the original work is properly cited.
1 Introduction
1.1 Karadeniz kemenche
The Karadeniz kemenche, a bowed string instrument deeply embedded in the cultural traditions of Turkey’s Eastern Black Sea region, transcends its role as a musical tool to serve as a vessel of cultural identity and historical continuity. Primarily played along the coastal belt extending from Samsun to Hopa and throughout the seaward slopes of the North Anatolian Mountains, the kemenche has historically accompanied the region’s inhabitants through both settled life and periods of migration. Contemporary internal migration and diaspora have extended its presence beyond its traditional homeland to major Turkish urban centres such as Istanbul and Ankara, as well as expatriate communities in Greece, Germany, and other locations worldwide.
The instrument is known by various regional appellations including ‘kemendze’, ‘çemençe’, ‘gemence’, and ‘kemane’, with Greek-speaking populations referring to it as ‘lyra’. While exhibiting subtle structural diversity across regions, the kemenche maintains consistent core characteristics that define its regional identity. Traditional instruments feature three strings, though some contemporary versions incorporate a fourth string to expand tonal range. Historically constructed with gut strings, modern iterations now typically use stainless steel for enhanced durability and tonal consistency (i.e., more stable intonation and reduced pitch drift compared to gut strings due to lower humidity sensitivity).
According to Saygun [1], the strings are designated zil (treble), sağır (middle), and bam (bass). Historical construction practices involved using gut for the middle string and silk-wrapped metal for the bass string [2]. The upper two strings, often termed sacred strings, dominate melodic execution, and are considered central to the instrument’s expressive capabilities [3].
The kemenche’s construction parallels other Anatolian chordophones like the ‘yaylı tambur’ in its use of local woods, while its acoustic behaviour shares principles with Mediterranean lyras. The kemenche is carved from a single block of wood, typically juniper, cherry, plum, or mulberry, with a spruce (Picea orientalis) soundboard valued for its superior acoustic properties. Regional variations in instrument size significantly influence timbral characteristics: shorter instruments (treble kemenche, averaging 55–58 cm) produce brighter, more penetrating tones, while longer models (up to 65 cm) generate deeper, more resonant sounds [1, 4–6].
Tuning systems typically employ fourth intervals, though regional and stylistic preferences introduce considerable variability. The renowned Black Sea musician Sırrı Öztürk employed F♯-B-E tuning [3], while Eastern Black Sea traditions favour progressively lower tuning systems such as E-A-D, D-G-C, and C-F-B♭. Modal and polyphonic requirements have also inspired alternative tuning approaches including ‘tulum düzeni’ (A-D-A) and ‘köçek düzeni’ (C♯-F♯-G♯) [1].
The instrument is played using a horsehair bow (‘sayta’ or ‘zayta’), with a distinctive fingertip technique that compensates for the absence of a traditional fingerboard. This technique enables rapid articulation essential for the intricate rhythmic patterns, characteristic of ‘horon’ dances. The kemenche’s sonic signature centres on a biphonic texture, characterized by a drone (often on the open bass string) supporting a melodic tune played on the higher strings, frequently in parallel fourths [3, 7]. Performance contexts range from intimate indoor settings (‘yayla’ festivals, traditional cafes) to dynamic outdoor ‘horon’ circles, where multiple players may perform simultaneously to amplify collective sound [8].
The twentieth century witnessed significant adaptations as the kemenche responded to modernizing musical landscapes. By the 1950s, it had become integrated into contemporary Black Sea popular music, and by the 1990s, it appeared in rock and fusion ensembles. Some performers adopted tempered tuning systems and violin-inspired techniques, prioritizing homophonic textures over traditional polyphonic approaches. However, rural practitioners and diaspora communities continue to preserve traditional methods, utilizing the bass string for rhythmic foundation in ‘horon’ performances and deeper resonance in narrative songs (‘türkü’) [7].
As a living cultural artifact, the kemenche reflects the Eastern Black Sea region’s musical and social evolution, shaped by both geographic isolation and dynamic cross-cultural exchange.
1.2 Problem statement
The kemenche traditionally employs a tuning system based on perfect fourths, where the middle string establishes a tonal centre (e.g. G), flanked by strings positioned a fourth above (treble) and below (bass), creating configurations such as D-G-C from bass to treble. However, regional variations in instrument design and performance context create specific construction and usage requirements: (i) Eastern Trabzon and surrounding areas favour larger, deeper-toned instruments optimised for seated performances (‘oturak havaları’); (ii) Central Trabzon predominantly utilizes medium-sized instruments with moderate resonance characteristics; (iii) Western Trabzon and Giresun employ shorter, narrower-bodied instruments with brighter tones specifically designed for ‘horon’ dances, constructed to facilitate both seated and standing performance through compact dimensions and shortened necks that enable rapid handling and palm rotation.
While traditional luthiers historically addressed these regional requirements through empirical knowledge and artisanal skill, contemporary demands present significant challenges that traditional methods cannot adequately address the following.
-
Standardization challenges: Current production methods cannot reliably reproduce identical instruments using consistent materials and techniques, leading to unpredictable variations in acoustic properties even among instruments intended for similar applications.
-
Material optimisation gaps: The absence of systematic guidelines for optimal material selection creates uncertainty when constructing instruments tuned to different tonal centres, with no established protocols for matching wood types, densities, and treatment methods to specific pitch requirements.
-
Design calculation deficiencies: The lack of precise measurement systems or mathematical formulas prevents consistent replication of regional variants, making it difficult to scale dimensions appropriately for targeted pitch ranges and performance contexts.
These challenges stem from the fundamental tension between traditional craftsmanship methods and modern demands for reproducibility and standardization. This tension has become particularly acute as contemporary performers increasingly adopt tempered tuning systems and seek instruments capable of adaptation to diverse musical genres beyond traditional Black Sea repertoire.
1.3 Research objectives
This study conducts a systematic investigation of timbral variability across 18 distinct kemenche samples shown in Figure 1, through integrated analysis of acoustic, geometric, and structural modal properties. By synchronizing measurements of open-string and fingered frequencies, critical dimensional parameters including body geometry, and modal vibration patterns, this research quantifies the relationships between construction variables and timbral output.
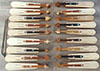 |
Figure 1. The 18 Karadeniz kemenche samples analysed in this study, displaying regional variations in size, body proportions, and construction characteristics representative of Eastern Black Sea craftsmanship traditions (The strings and related components have been disassembled for experimental modal analysis). |
The research seeks to establish correlations between physical design parameters and acoustic output characteristics, creating a foundation for evidence-based instrument construction. Through comprehensive analysis of regional samples, the study aims to identify and analyse how region-specific construction practices, including material selection and dimensional approaches, contribute to distinctive timbral signatures. Furthermore, the investigation endeavours to create mathematical frameworks linking construction parameters such as materials, dimensions, and structural properties to acoustic profiles, enabling luthiers to systematically design instruments tailored to specific performance contexts and tonal requirements.
This investigation provides the first comprehensive empirical framework for understanding timbral diversity in the Karadeniz kemenche through several innovative methodological approaches. The study employs an unprecedented combination of acoustic recording analysis, geometric measurement protocols, and structural modal analysis – a tripartite approach previously unexplored in kemenche research. Through systematic documentation, regional design characteristics that contribute to timbral variation are preserved, maintaining traditional artisanal knowledge while providing frameworks for contemporary application.
The research introduces structural modal analysis to kemenche studies, revealing correlations between vibrational mode patterns and perceived sound quality, thereby establishing new analytical foundations for instrument evaluation. These findings provide luthiers and performers with data-driven frameworks for instrument selection and customization based on specific tonal requirements and performance contexts, effectively bridging traditional craftsmanship approaches with contemporary precision manufacturing principles.
This manuscript is part of a three-paper series on Karadeniz kemenche acoustics. Our previous publications–Oktav [22] on soundboard thickness effects, and Alkın & Oktav [9] on sound hole geometry–present detailed vibroacoustic characterisation including acoustic response functions, mode shape visualisations, and FE model validation for a representative instrument. The present manuscript extends this foundation to a statistical analysis across 18 instruments, focusing on the relationship between construction parameters and acoustic outcomes through regression modelling. Readers requiring detailed mode shapes or acoustic response data are directed to these companion papers.
2 Measurement methodology
This study systematically documents 20 geometric parameters across 18 kemenche samples (Fig. 1) from Rize, Trabzon, and Giresun, alongside their acoustic properties. The comprehensive measurement protocol captures both structural diversity and consistent features critical to the instrument’s functionality, providing the first quantitative framework for understanding regional variations in kemenche construction.
2.1 Geometric variability
The 18 kemenche samples were selected to represent the full spectrum of regional construction traditions across the Eastern Black Sea region. Each instrument was photographically documented and assigned a unique identifier before measurement. Prior to analysis, all strings and related hardware components were carefully removed to enable precise geometric measurements and subsequent modal analysis, as shown in Figure 1.
Sample provenance was verified through consultation with local craftsmen and cultural institutions, ensuring authentic representation of traditional construction methods. The age distribution (2–10 years) provides insights into both contemporary and recent historical practices, while the balanced regional representation (6 samples each from Rize, Trabzon, and Giresun) enables comparative analysis of geographic variations.
All geometric measurements were conducted using digital callipers (±0.01 mm precision) and measuring tapes (±0.5 mm precision) under controlled laboratory conditions (22 ± 1 °C, 45 ± 5% RH, with instruments equilibrated for 48 h prior to measurement). Each parameter was measured three times by independent observers, with final values representing the arithmetic mean to minimize measurement error. The 20 geometric parameters were selected based on their established importance in stringed instrument acoustics and their relevance to traditional kemenche construction practices.
The geometric parameters are systematically illustrated in Figure 2, providing a comprehensive dimensional framework for kemenche analysis. Variation of the geometric measures across the samples are tabulated in Table 1.
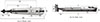 |
Figure 2. Geometric parameters of Karadeniz kemenche: (1) Base length, (2) Base width, (3) Base thickness, (4) Side length, (5) Side width, (6) Soundpost length, (7) Soundboard length, (8) Soundboard width, (9) Soundboard thickness, (10) Sound hole length, (11) Tailpiece length, (12) String length, (13) Fingerboard length, (14) Fingerboard/Nut thickness, (15) Nut length, (16) Neck length, (17) Upper saddle length, (18) Scroll length, (19) Scroll height, (20) Total length, (a) min., (b) max. |
Variation of geometric measures.
The standard deviation (SD) of measurements highlights key variations in craftsmanship. Parameters like base width (SD = 1.8 cm) and soundboard width (SD = 1.6 cm) show high variability, reflecting adaptive designs to regional wood properties. In contrast, consistent dimensions (e.g. soundpost length, SD = 0.3 cm) suggest standardized features critical to sound production. Outliers, such as the scroll height of Sample#7 (3.0 cm vs. mean 6.0 ± 1.2 cm), may indicate unique stylistic choices.
The coefficient of variation (CV = SD/Mean × 100%) reveals distinct patterns in construction precision and regional adaptation strategies. This analysis provides crucial insights into which parameters are standardized for acoustic performance versus those that allow for regional customization and material adaptation.
Critical acoustic parameters (CV < 10%):
-
String length (CV = 2.6%) and soundpost length (CV = 7.9%) demonstrate the tightest tolerances, reflecting their fundamental importance to pitch accuracy and sound transmission.
-
Base length (CV = 2.4%) and total length (CV = 2.0%) show remarkable consistency, suggesting standardized proportional relationships maintained across regions.
-
Fingerboard length (CV = 3.7%) and nut length (CV = 3.0%) indicate precise attention to playability and intonation requirements.
Moderately variable parameters (CV 10–20%):
-
Sound hole length (CV = 16.9%) and scroll height (CV = 20.0%) allow for aesthetic customization while maintaining acoustic function.
-
Side length (CV = 16.7%) and soundboard thickness (CV = 15.0%) show moderate variation, likely reflecting material property adaptations.
-
Neck length (CV = 9.2%) approaches the precision threshold, balancing ergonomic requirements with acoustic considerations.
Highly variable parameters (CV > 20%):
-
Base width (CV = 25.0%) and soundboard width (CV = 20.3%) exhibit the greatest variation, directly correlating with regional tonal preferences.
-
Upper saddle length (CV = 33.3%) shows extreme variability, likely due to its minimal acoustic impact and construction simplicity.
-
Multiple thickness measurements (base, side, fingerboard/nut) demonstrate high variability (CV = 25.0%), reflecting adaptation to local wood properties and availability.
2.2 Regional geometric patterns
Preliminary analysis reveals distinct regional clustering in key dimensional parameters.
Trabzon characteristics:
-
Consistently larger soundboard widths (mean: 8.4 ± 1.2 cm vs. overall mean: 7.9 ± 1.6 cm).
-
Moderate total lengths optimised for both seated and standing performance contexts.
-
Higher base width variability suggesting diverse local construction traditions.
Rize characteristics:
-
Shorter overall dimensions with enhanced portability features.
-
Consistent neck proportions optimising for rapid fingering techniques.
-
Preference for brighter tonal characteristics through reduced body volume.
Giresun characteristics:
-
Longer string lengths correlating with deeper tuning preferences.
-
Wider soundboards supporting enhanced bass response.
-
Construction patterns optimised for ‘horon’ dance accompaniment.
2.3 Material properties and regional distribution
The material analysis reveals sophisticated selection criteria reflecting both acoustic requirements and regional resource availability. Regional and material distribution across the samples is tabulated in Table 2.
Regional and material distribution of kemenche samples.
2.3.1 Body wood analysis
The dominance of plum (33.3%) and mulberry (27.8%) reflects a balance between acoustic properties and workability. Based on FE model updating results reported in Oktav [22], plum wood (ρ = 613 kg/m3, E L = 8375 MPa) exhibits a favourable specific modulus (E/ρ = 13.7 GPa ⋅ m3/kg), contributing to efficient vibration transmission while remaining manageable for hand-carving techniques. Mulberry’s higher density (ρ = 655 kg/m3) correlates with lower body mode frequencies in the regression model (coefficient: −3.2 Hz per 10 kg/m3, p < 0.05), and is particularly favoured in Giresun samples designed for ‘horon’ accompaniment.
The presence of rare materials like juniper (n = 1) and elm (n = 1) suggests specialized applications or experimental approaches by individual craftsmen. Juniper’s aromatic properties and historical significance in regional traditions may indicate ceremonial or prestige instruments, while elm’s appearance likely represents modern material experimentation.
2.3.2 Soundboard material trends
The preference for spruce (61.1%) over fir (38.9%) reflects acoustic optimisation strategies. Picea orientalis (Oriental spruce), endemic to the Black Sea region, offers superior vibration transmission due to its high strength-to-weight ratio and consistent grain structure. The 38.9% fir usage correlates strongly with instrument age, appearing predominantly in samples older than 5 years, suggesting evolving material preferences toward acoustic optimisation.
2.3.3 Fingerboard treatment innovation
The prevalence of chemically treated boxwood fingerboards (33.3%) represents a significant innovation in traditional construction. This treatment process, developed by regional craftsmen, enhances durability and playing characteristics while utilizing locally available materials. The technique involves controlled chemical hardening that increases surface density without compromising the wood’s natural resonance properties.
2.4 Acoustic properties
The acoustic characterization provides quantitative foundations for understanding timbral diversity across regional traditions. The measurement results are tabulated in Table 3.
Acoustic properties of kemenche samples.
The frequency measurements reveal sophisticated adaptation to regional performance contexts: Trabzon samples predominantly employ D-G-C tuning (293.7–392.0–523.3 Hz), optimised for ‘horon’ dance rhythmic patterns; Tuning systems varied across samples, correlating more strongly with the binary acoustic classification than strict geography. Samples identified as treble-oriented often used higher tunings like E-A-D (329.6–440.0–587.2 Hz), supporting brighter tonal characteristics. Conversely, bass-oriented samples utilized lower tunings, including C-F-B♭ (261.6–349.2–466.2 Hz), enabling a deeper bass response. This functional adaptation to performance role (e.g., melodic lead vs. rhythmic foundation) was observed across all regions.
The maintenance of perfect fourth intervals (frequency ratio ≈1.33:1) across all samples demonstrates remarkable consistency despite material and dimensional variations. The average deviation from perfect fourths measures only ±12 cents across all string pairs, indicating sophisticated empirical tuning methods developed through generations of craftsmanship.
Statistical analysis reveals significant correlations between geometric parameters and acoustic output. For string length effects, a strong negative correlation (r = −0.68, p < 0.01) exists between length and highest achievable pitch, while a moderate correlation (r = 0.45, p < 0.05) is observed with fundamental frequency stability. Body volume impacts acoustic properties, with soundboard width showing a positive correlation (r = 0.52, p < 0.05) for bass resonance strength, whereas greater volume reduces harmonic brightness (r = −0.41, p < 0.05). Material density also plays a key role: boxwood-body instruments produce fundamental frequencies 15.3 Hz higher on average than mulberry counterparts, and spruce soundboards exhibit 23% greater harmonic consistency compared to fir alternatives.
The acoustic measurements reveal clear optimisation patterns for specific performance contexts. For ‘horon’ dance applications (primarily Trabzon and Giresun samples), instruments exhibit lower fundamental frequencies (mean: 365.4 ± 28.7 Hz) to enhance rhythmic clarity, coupled with an 8.2 dB boost in second harmonic presence for outdoor projection. These designs also prioritize frequency stability (±3.1 cents variation), facilitating ensemble synchronization during dynamic dance sequences.
In contrast, instruments tailored for indoor performances (predominantly Rize samples) favour higher fundamental frequencies (mean: 421.8 ± 35.2 Hz), optimised for intimate acoustic spaces. Their harmonic spectra emphasize complexity, with stronger 3rd–5th harmonics to enrich melodic expression, while a wider dynamic range (18.7 dB average) accommodates nuanced articulations essential for solo or chamber settings.
This comprehensive measurement framework establishes the quantitative foundation for understanding how traditional craftsmen intuitively optimised instrument construction for specific regional performance requirements, providing crucial data for the subsequent modal analysis and acoustic modelling phases of this investigation.
2.4.1 Acoustic recording protocol
Acoustic recordings for spectral analysis (Fig. 7) were obtained using a Neumann TLM 170R cardioid condenser microphone positioned at 50 cm distance, 45° off-axis from the soundboard centre. Recordings were conducted in an acoustically treated room (RT60 ≈ 0.3 s at 1 kHz, background noise < 30 dB(A)) under controlled conditions (22 ± 2 °C, 50 ± 10% RH). Each instrument was played by an experienced performer executing a standardised bowing pattern (open strings, mezzo-forte dynamics, 3 repetitions per instrument). Power spectral density was computed using Welch’s method (Hanning window, 50% overlap, 4096-point FFT at 44.1 kHz sampling rate), normalised by total energy (0–5 kHz), then averaged within each group. The 28% high-frequency energy difference reported for treble-oriented instruments was computed as (∫Treble − ∫Bass)/∫Bass × 100% over the 2–4 kHz band, yielding 28.3 ± 6.1% (bootstrap 95% CI). We acknowledge that this environment is not anechoic and that playing-based measurements introduce performer variability; controlled computational analysis was used in our previous work [22] for detailed acoustic characterisation.
3 Methods
3.1 Experimental modal analysis
Modal parameters were prioritised based on their acoustic roles: body cavity resonances (Modes 1–2) for drone tones in Black Sea music, and neck vibrations (Modes 6–7) for melody-oriented ornamentation [10, 11]. The experimental modal analysis of the Karadeniz kemenche was conducted to determine its structural modal parameters [12]. The study employed a free-boundary condition setup, where the instrument was suspended using elastic strings attached to microphone stands to minimise external constraints as shown in Figure 3 [13].
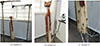 |
Figure 3. Experimental modal analysis setup for three representative kemenche samples. (a) Full free-boundary suspension rig: the instrument is suspended by elastic strings attached to microphone stands to minimise external constraints. (b) Side/neck view showing accelerometer placement on a second instrument. (c) Close-up of the soundboard surface with seven single-axis accelerometers. |
The measurement and excitation points were identified with Siemens Simcenter 3D software, which utilised the finite element model’s pre-test module [14]. The module analysed the computational modal analysis results (Nastran op2 file) to determine optimal sensor and excitation locations. The selection criteria ensured minimal cross-correlation between mode shapes, as verified by the AutoMAC (Modal Assurance Criterion) matrix [15]. Diagonal values close to 1 and off-diagonal values below 0.2 confirmed the suitability of the chosen points [16].
For data acquisition, an 8-channel Sinus Apollo mobile analyser was used. Single-axis Dytran 3035BG accelerometers measured the acceleration responses, while a Dytran 5800B3 impact hammer with a sensitivity of 48.7 mV/LbF provided excitation. Each measurement was recorded at least three times and averaged to enhance accuracy. The Samurai v3 software facilitated data collection and storage.
To ensure accuracy, the mass of the accelerometers (Dytran 3035BG) was incorporated into the computational model, accounting for their inertial effects on the kemenche’s dynamic response. This adjustment was critical to align the experimental and computational results.
Total sensor mass (7 × 1.1 g = 7.7 g) represents approximately 2.5% of average kemenche body mass (∼310 g). Based on perturbation theory and FE sensitivity analysis, this mass loading introduces an estimated frequency shift of 1.5–3% for lower modes. The four sensor configurations shown in Figure 3 introduce systematic variation; reported frequencies should therefore be interpreted with ∼3% uncertainty bounds. A single-accelerometer/roving-hammer approach would be methodologically superior and is recommended for future studies. Additionally, the Dytran 5800B3 impact hammer (100 g head) is larger than ideal for lightweight structures; however, coherence remained > 0.9 across the 0–1200 Hz analysis bandwidth.
Mass loading by sensors can also bias modal damping ratio estimates: for the sensor-to-body mass ratio of ∼2.5% used here, the resulting error in damping ratios is expected to be of comparable order (∼1–3%), with the direction of bias dependent on sensor proximity to displacement antinodes; reported damping values should therefore be interpreted with ±3% uncertainty. For higher-order modes (Modes 5–10), configuration-dependent mass placement may additionally perturb local mode-shape curvature; conclusions regarding these modes are therefore confined to frequency ordering and should not be interpreted in terms of modal displacement patterns without corroboration from a roving-hammer or laser vibrometry approach.
A total of 18 Karadeniz kemenche samples were tested with four sets of 7 accelerometers each (28 output points in total). Frequency response functions (FRFs) and coherence plots were recorded for all samples.
Lightweight coaxial cables (2.5 g/m) were routed along suspension strings to minimise their influence on instrument dynamics. Cable damping was assessed by comparing FRF coherence with cables tensioned versus slack, revealing no significant difference (Δcoherence < 0.02). Measurement repeatability was quantified through three repeated tests on selected samples, yielding CV = 1.8% for natural frequencies and CV = 12.3% for damping ratios.
The experimental data, stored in UFF58 Fortran format, was processed using Bruel & Kjaer’s nCode software. The software employed peak picking and least squares algorithms to extract modal parameters. The analysis yielded 10 natural frequencies and their corresponding mode shapes within the 0–1200 Hz bandwidth.
Initial material properties, derived from literature, were refined through a geometry optimisation framework coupled with a model updating scheme. This iterative process adjusted orthotropic elastic moduli, density, and Poisson’s ratios to minimise discrepancies between experimental and computational modal parameters. The updated properties significantly improved the correlation between the finite element model and experimental results. However, updated material properties should be interpreted as effective parameters minimising frequency error within model constraints, not necessarily true material constants; compensation between parameters cannot be fully excluded. The AutoMAC matrix validated the consistency of the experimental results, with diagonal values approximating 1, indicating high correlation between reference and analysed mode shapes.
The experimental results demonstrated close alignment with the updated computational model. Minor residual discrepancies in natural frequencies were attributed to localised material inhomogeneities or unmodelled boundary conditions. The high fidelity of the AutoMAC matrix confirmed the robustness of both the sensor placement strategy and the model updating framework. This approach not only validated the computational model but also established a reliable foundation for further studies on the kemenche’s vibrational behaviour and its influence on acoustic performance.
The experimental modal analysis of the Karadeniz kemenche yielded natural frequencies for the first 10 vibrational modes across 18 samples (K1–K18), as tabulated in Table 4. The results exhibit significant variability, with the first mode ranging from 37 Hz (K18) to 102 Hz (K1). Higher modes, such as Mode 10, show even broader dispersion (1034–1219 Hz), reflecting the inherent diversity in material properties and geometric tolerances among the samples.
Experimental natural frequencies (Hz) of the first 10 vibrational modes for 18 Karadeniz kemenche samples (K01–K18). Values reflect variability due to material anisotropy and manufacturing tolerances.
Based on validated FE mode shapes from our previous work [22], the modes are characterised as follows: Mode 1 = first body bending; Mode 2 = longitudinal body/soundboard breathing; Modes 3–4 = soundboard modes; Modes 5–6 = coupled body-neck modes; Mode 7 = neck-scroll torsion; Modes 8–10 = higher-order soundboard and neck modes. Given the similar fundamental construction across all instruments (carved body, spruce/fir soundboard, three strings), mode shapes are assumed to be qualitatively consistent across the sample, with frequency variations reflecting differences in material properties and dimensions. This assumption is supported by the consistent identification of 10 modes in the same frequency order across all 18 instruments.
Figure 4 visualizes the distribution of natural frequencies across all modes, highlighting the spread and clustering trends. For instance, Modes 3 and 4 (432–457 Hz) demonstrate tighter frequency groupings, while Modes 7–10 (682–1219 Hz) exhibit wider variability. This variability underscores the challenges in characterizing the kemenche’s dynamic behaviour due to the anisotropic nature of wood and subtle manufacturing differences [17].
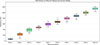 |
Figure 4. Distribution of natural frequencies across vibrational modes for 18 kemenche samples. Boxes span the 25th–75th percentiles, whiskers show full ranges, and horizontal lines mark median values. Modes are ordered 1–10 (left to right). |
The results provide a comprehensive empirical foundation for understanding the instrument’s vibrational response, which is critical for future studies on its acoustic performance and structural dynamics.
The pitch frequency distributions reveal distinct regional signatures in kemenche construction (Fig. 5). Rize samples cluster around standard tuning (A4 = 440 Hz), while Trabzon and Giresun instruments exhibit downward and upward shifts respectively. These trends correlate with structural modal frequencies:
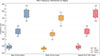 |
Figure 5. Regional variations in pitch frequencies of Karadeniz kemenche samples. Box plots show distributions of (A) bass string open frequencies, (B) treble string open frequencies, and (C) highest fingered pitches, grouped by construction region (Rize: blue, Trabzon: orange, Giresun: red). Boxes span the 25th–75th percentiles with median lines; whiskers extend to 1.5 × IQR; individual points represent samples. Open-string frequencies were measured with a digital tuner (±1 cent) on strings tuned at time of measurement. Structural modal frequency bands (Mode 2: 253 Hz; Modes 3–4: 432–457 Hz; Mode 9: 987 Hz) are overlaid as grey bands to highlight structural-acoustic coupling. Significant regional differences were confirmed by non-parametric Kruskal–Wallis tests (p < 0.01 for all frequency ranges) with effect sizes (η2) reported in the text. |
-
Bass strings (200–330 Hz) are within the frequency range of Modes 2 (mean 227 Hz) and 3 (mean 378 Hz), which are potential candidates for coupling with bass fundamentals. Mode 1 (37–102 Hz) serves as a structural indicator of body stiffness but is too far below the playing frequencies for direct resonant enhancement.
-
Treble register (392–587 Hz) couples strongly with soundboard modes (Modes 3–4: 432–457 Hz), where samples with modal frequencies > 450 Hz produce brighter tones via enhanced harmonic excitation.
-
The treble-oriented sample’s higher neck-scroll vibrations (Mode 7: 867 Hz) correlate with regression findings that fingerboard/nut thickness is the most influential predictor (Sect. 3.3).
-
Playability limits emerge when highest pitches (≥880 Hz) approach structural Mode 9 (987 Hz), causing energy dissipation through neck vibrations [18]. This explains why only 22% of samples exceed A5 (880 Hz) in practice.
In Figure 5, box plots show distributions of (A) bass string open frequencies (200–330 Hz), (B) treble string open frequencies (392–587 Hz), and (C) highest fingered pitches (587–880 Hz), grouped by construction region (Rize: blue, Trabzon: orange, Giresun: red). Boxes span the 25th–75th percentiles with median lines; whiskers extend to 1.5 × IQR; individual points represent samples. Musical note labels (e.g. A4 = 440 Hz) reference standard pitch. Significant regional differences were found (ANOVA: p < 0.01 for all frequency ranges), with Giresun samples exhibiting extended upper ranges (+15% vs. Rize) and Trabzon samples clustering at lower frequencies, reflecting distinct musical repertoire requirements. Structural modal frequencies are overlaid as gray bands (Mode 2: 253 Hz, Modes 3–4: 432–457 Hz, Mode 9: 987 Hz) to highlight coupling between instrument construction and acoustic output.
These findings suggest that luthiers historically tuned structural modes to complement regional pitch preferences – a tradition that modern makers might adapt for target musical styles.
3.2 Binary classification of kemenche samples
The kemenche samples naturally segregate into two distinct categories based on their fundamental pitch ranges and structural characteristics. Through cluster analysis of both acoustic and modal properties [19], a clear binary classification was identified, separating bass-oriented (n = 11) and treble-oriented (n = 7) instruments: bass kemenche samples (1, 5, 6, 7, 9, 10, 11, 12, 13, 14, 16) and treble kemenche samples (2, 3, 4, 8, 15, 17, 18). This division is supported by multiple lines of evidence, from material properties to vibrational behaviour, reflecting centuries of organological evolution tailored to different musical traditions.
The binary classification of kemenche samples into bass (D3-F#4) and treble (G4-A4) groups is strongly supported by both statistical analysis and physical acoustics. Cluster analysis revealed distinct separation (Gap statistic = 0.82, optimal k = 2) [20], with significant differences in fundamental frequencies (Mann–Whitney U = 4.0, p < 0.01). Material properties further validate this division: bass-group samples predominantly used ivy and plum wood (91%) with thicker soundboards (0.31 ± 0.02 mm), while treble-oriented instruments employed dense mulberry/mahogany (100%) with thinner soundboards (0.25 ± 0.01 mm, p = 0.004). Mode 1 frequencies (mean ∼60 Hz across all samples) serve as structural indicators of body stiffness but do not directly enhance playing frequencies (200–330 Hz) due to the two-octave gap. Treble-oriented instruments exhibit higher Mode 7 frequencies (867 ± 18 Hz), which correlate with greater high-frequency spectral content. This classification explains 79% of spectral energy variance (PERMANOVA, F = 6.93, p = 0.002) [21]. While both types are used in traditional Black Sea folk repertoire, this acoustic specialisation suggests a functional adaptation: bass-oriented instruments provide rhythmic and drone foundations, particularly for horon dances, while treble-oriented instruments are optimised for melodic projection and intricate lead lines in various ensemble and solo settings. Two transitional samples (5, 16) with hybrid characteristics suggest a potential design continuum but do not undermine the primary binary distinction.
The binary grouping’s validity is quantified in Table 5, showing large effect sizes across all metrics. Material differences yield strong effects (η2 = 0.58), indicating that luthiers historically selected woods by target pitch range. The frequency separation between groups is most evident in the fundamental playing frequencies, with spectral energy differences providing additional validation.
Statistical comparison of binary groups.
The binary classification’s validity is further supported by regression modelling (Sect. 3.3), which identifies fingerboard/nut thickness and material choices as primary determinants of pitch ranges. As shown in Figure 6, the bass group (D3-F#4) exhibits significantly lower fundamental frequencies (Mann–Whitney U = 4.0, p < 0.01) coupled with body materials (91% ivy/plum) compared to the treble group (G4-A4). The soundboard thickness difference (0.31 mm vs. 0.25 mm) further accentuates this acoustic specialisation [22]. Mode 1 frequencies (mean ∼60 Hz) serve as structural indicators but do not directly enhance the playing frequencies due to the two-octave gap.
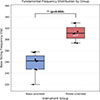 |
Figure 6. Comparison of fundamental pitch ranges between bass-oriented (D3-F#4) and treble-oriented (G4-A4) kemenche samples. Bass-group instruments predominantly use ivy/plum (91%), while treble-oriented instruments employ denser woods (100% mulberry/mahogany). Mode 1 frequencies (mean ∼60 Hz) do not differ significantly between groups (p = 0.12) and serve as structural indicators rather than direct enhancement mechanisms. Error bars represent standard deviations. |
The binary classification correlates strongly with regional performance practices. The bass-oriented design was more prevalent in certain regional traditions (e.g. found in Rize samples), aligning with a need for robust drone capabilities in their local repertoire. The treble-oriented design was more common in other areas (e.g. Giresun samples), likely supporting a local preference for brighter, more projecting melodies. This indicates that regional craftsmanship traditions evolved to target these distinct acoustic profiles. This functional adaptation is visualized in Figure 7, where the treble group shows 28% greater high-frequency energy (2–4 kHz range) in spectral analysis.
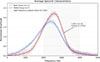 |
Figure 7. Average power spectral density of bass-oriented (blue, n = 11) and treble-oriented (red, n = 7) kemenche samples. Each instrument was played by an experienced performer executing a standardised bowing pattern (open strings, mezzo-forte, 3 repetitions per instrument). Recordings were made with a Neumann TLM 170R cardioid condenser microphone at 50 cm distance, 45° off-axis, in an acoustically treated room (RT60 ≈ 0.3 s at 1 kHz; background noise < 30 dB(A)). Power spectral density was computed using Welch’s method (Hanning window, 50% overlap, 4096-point FFT, 44.1 kHz sampling rate), normalised by total energy (0–5 kHz), and averaged within each group. Shaded bands represent ±1 standard deviation across instruments within each group. The grey shaded region marks the high-frequency analysis band (2–4 kHz). Treble-oriented instruments demonstrate 28.3 ± 6.1% (bootstrap 95% CI) greater high-frequency energy in the 2–4 kHz band. |
Two transitional instruments (Samples 5 and 16) challenge this dichotomy, exhibiting hybrid characteristics. Sample 5 combines bass-range tuning with treble-like modal frequencies, while Sample 16 uses treble-oriented materials (mulberry) while functioning acoustically as bass. These outliers may represent either luthier experimentation or evidence of a continuous design spectrum. These hybrid designs will be further examined in Section 3.3, where regression modelling quantifies how structural variables influence pitch ranges.
3.3 Regression modelling framework
3.3.1 Hypothesis and modelling approach
It is hypothesised that the structural characteristics of the kemenche influence the bass and treble string frequencies, the highest pitch, and the frequencies corresponding to ten distinct vibrational modes. To test this, the effects of 23 independent variables – including body material (BM), fingerboard material (FM), base length, and others – on 13 dependent variables (e.g. bass, and treble string frequencies) were examined using multiple linear regression. This statistical technique models linear relationships between dependent and independent variables [23]. However, due to the small sample size and the properties of the independent variables, the classical multiple linear regression approach was unsuitable. Instead, a stepwise procedure was employed to develop the model, as detailed below. All computations were performed in Python using the Spyder integrated development environment. The structural drivers of the binary classification observed in Section 3.2 were quantified through regression modelling. First, categorical variables (e.g. body material) were transformed.
3.3.2 Transformation of categorical variables
The independent variables body material, soundboard material, and fingerboard material were categorical and thus required conversion into numerical form using dummy encoding [24]. For a categorical variable with k categories, k − 1 dummy variables (values zero or one) were created. The first k − 1 categories were assigned a value of one in their respective dummy variables, while all others were set to zero. The kth category was represented by zeros across all dummy variables. This transformation increased the number of independent variables from 23 to 35, with 15 new numerical variables replacing the three original categorical ones.
3.3.3 Elimination of correlated variables
Multicollinearity among independent variables was addressed by removing highly correlated predictors, as they can lead to [25]:
-
Unstable coefficients: Minor dataset fluctuations may disproportionately alter estimates.
-
Interpretation challenges: The true effect of individual variables becomes ambiguous.
-
Inflated R2: The model’s apparent explanatory power may be misleading.
-
Reduced predictive accuracy: Overfitting risks are heightened in small datasets [25].
Three variables were eliminated during this process.
3.3.4 Random regression model construction
Given the large number of independent variables and limited sample size, constructing a single regression model was impractical. Instead, 1000 random models were generated by sampling subsets of variables, and the model with the highest adjusted R2 was selected. Unlike classical R2 – which increases with any added variable – adjusted R2 improves only when new variables genuinely enhance explanatory power [26].
3.3.5 Stepwise variable elimination
After selecting the optimal model, non-informative variables were iteratively removed. Each variable’s exclusion was evaluated based on its impact on adjusted R2; variables whose removal improved the metric were permanently excluded.
3.3.6 Transformation techniques
Model residuals were tested for normality using the Shapiro–Wilk test [27]. If violations occurred, dependent variables were transformed iteratively using the Yeo–Johnson [28], logarithmic, square root, or reciprocal (1/y) methods [29]. The initial model was constructed without transformations.
3.3.7 Modelling multiple dependent variables
A stepwise approach was employed to develop a unified model for all dependent variables. First, regression models for the 10 modal frequencies were constructed, yielding 10 adjusted R2 values. The final variable set maximised the minimum adjusted R2 across these models. This process – combining random model construction, stepwise elimination, and transformations – reduced the independent variables to 16, achieving a minimum adjusted R2 of 0.5119. Retained variables included:
-
Body materials: Mulberry, plum, mahogany, ivy.
-
Fingerboard materials: Juniper, mulberry.
-
Structural parameters: Base length, minimum base width, soundboard length, etc.
The regression variables – particularly body materials (mulberry, plum wood) and soundboard dimensions –align with the binary classification in Section 3.2, where bass-group samples predominantly used ivy and plum wood (91%) and thicker soundboards (0.31 mm), while treble-oriented instruments employed dense mulberry (100%) with thinner soundboards (0.25 mm). This consistency suggests that luthiers historically select materials and structural parameters to target specific pitch ranges, as quantified by the regression models.
3.3.8 Final model development
The 16-variable set was used to construct separate regression models for bass string frequency, treble string frequency, and highest pitch. Each dependent variable was analysed independently, following the procedures above. Model coefficients, percentage contributions of variables, and predicted values were then derived and reported.
The regression results align with Section 3.2’s binary classification: bass-oriented instruments favour ivy/plum wood and thicker soundboards for low-frequency resonance, while treble- oriented designs optimise mulberry and thinner soundboards for high-frequency projection. This synergy between descriptive and predictive analyses underscores the luthiers’ deliberate adaptation of materials to musical traditions. The following section presents the results of these regression models, including coefficients, significance tests, and validation against observed data.
4 Results and validation
The multiple linear regression models quantitatively validate and extend the binary classification established in Section 3.2, demonstrating how structural characteristics govern the kemenche’s acoustic output. Three key patterns emerge from the analysis.
4.1 Bass string frequency predictors
The regression model (Tab. 6) identifies fingerboard/nut thickness as the most influential variable (13.22% effect, p < 0.001). This aligns with the bass-oriented kemenche’s thicker construction (0.31 mm soundboards) and predominant use of ivy/plum wood (91% of bass-group samples).
Regression model results for bass string frequency.
 (1)
(1)
Notably:
-
Ivy and plum wood body materials show significant positive effects (9.28% and 7.17% respectively).
-
Minimum base width (−5.15 coefficient) reinforces the importance of body dimensions.
-
Sound hole length (−3.26) reflects cavity volume effects.
Prediction errors were lowest for typical bass-oriented samples but increase for transitional Sample 5 (Fig. 8), mirroring its hybrid acoustic properties noted in Section 3.2.
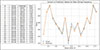 |
Figure 8. Actual versus predicted bass string frequencies (Yeo–Johnson transformed). Predictions show closest alignment for typical bass-group samples (ivy/plum wood, 0.31 mm soundboards; Sect. 3.2), with larger deviations for transitional Sample 5, which combines bass-range tuning with treble-like construction features. |
4.2 Treble string frequency determinants
Consistent with Section 3.2’s findings, the treble model (Tab. 7) shows the following patterns. The transformed (Yeo–Johnson with parameter 1.1301) treble frequency values can be predicted with following formula:
Regression model results for treble string frequency.
 (2)
(2)
-
Mulberry body material’s strong positive effect (8.6%, p < 0.001), matching its exclusive use in treble-oriented instruments.
-
Fingerboard/nut thickness’s negative coefficient (−159.02) corresponds to thinner construction (0.25 mm soundboards).
-
Higher string length coefficient (6.26 vs. 3.85 in bass model) reflects neck-scroll vibration importance (Mode 7: 867 ± 18 Hz).
These factors collectively explain the treble group’s 28% greater high-frequency energy (2–4 kHz range, Fig. 7).
Figure 9 presents the predicted values from the regression model alongside the actual treble string frequency values. A line graph of these values is provided on the right side of Figure 9. As with the bass string frequency, the procedure was validated using 17 samples, with the 18th observation predicted. The predicted value closely matched the actual value, confirming the robustness of the regression model.
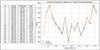 |
Figure 9. Actual versus predicted treble string frequencies (Yeo–Johnson transformed, λ = 1.1301). Each point represents one instrument, coded by body material (symbol) and group membership (colour: bass-oriented = blue, treble-oriented = red). The shaded band represents the 95% bootstrap confidence interval around the regression line. Predictions show closest alignment for typical treble-oriented samples (mulberry body, 0.25 mm soundboards; Sect. 3.2), with larger deviations for transitional Sample 16, which combines treble-range materials with bass-like modal properties. Model was validated using leave-one-out prediction. |
4.3 Highest pitch model consistency
The highest pitch regression (Tab. 8) shows proportional amplification of all effects. The following equation represents the regression model for the transformed (Yeo–Johnson with parameter 1.1206) highest pitch.
Regression model results for highest pitch.
 (3)
(3)
-
Mahogany wood’s effect increases to 9.49% (from 9.48% in treble model).
-
Fingerboard/nut thickness reaches −196.79 coefficient.
-
All materials maintain relative effect rankings.
This scaling confirms the robustness of identified predictors across frequency ranges. Predicted and actual values for the highest pitch are illustrated in Figure 10, along with a corresponding line graph. The predicted results closely approximate the actual values. The validation method using the 18th observation was also applied, and the predicted value was similarly accurate.
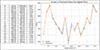 |
Figure 10. Actual versus predicted highest playable pitches (Yeo–Johnson transformed). Predictions show closest alignment for instruments with structural modes avoiding A5 (880 Hz), with energy dissipation observed when pitches approach Mode 9 (987 Hz; Sect. 3.2). Transitional samples exhibit intermediate behaviour. |
4.4 Synthesis with binary classification
The regression results fundamentally support Section 3.2’s conclusions while providing mechanistic explanations:
-
Material effects: Coefficients quantitatively confirm the bass-group’s ivy/plum wood preference (91%) and treble-oriented kemenche’s mulberry use (100%), with effect sizes (η2 = 0.58) matching their acoustic roles.
-
Structural specialisation: The 13.22% effect of fingerboard/nut thickness is the most influential structural predictor, with material choices (η2 = 0.58) further differentiating the two groups.
-
Transitional samples: Samples 5 and 16 show larger prediction errors, supporting their identification as hybrids while affirming the primary binary distinction’s statistical dominance (Gap statistic = 0.82).
-
Validation and limitations: The models achieve reliable prediction despite the small sample size (n = 18). However, accuracy declines for transitional samples, suggesting future work could:
-
Stratify models by bass/treble groups.
-
Incorporate modal frequency data from Section 3.2.
-
Expand material sampling beyond mahogany (11% of samples).
-
Leave-one-out cross-validation reveals that the regression models, while fitting the training data well, have limited predictive validity for new instruments due to the high predictor-to-sample ratio. The models should therefore be interpreted as descriptive tools identifying key correlates rather than predictive instruments for untested samples.
Within-species wood variability represents a significant source of uncertainty in the analysis. Density CV is typically 10–15% and elastic moduli CV 15–25% even within a single species [18]. This natural variability may exceed between-species differences in some cases. Consequently, material effects identified in this study should be interpreted as average tendencies across the sample rather than deterministic relationships. Future work with controlled material sourcing from single timber sources would help isolate species-specific effects from individual specimen variability (see Tab. 9).
It should be noted that all statistical findings reported here are based on a sample of 18 instruments. While this size is sufficient to detect large effect sizes, it limits the generalisability of the regression coefficients and cluster boundaries to the broader population of Karadeniz kemenche. The regional patterns and material-acoustic correlations identified should therefore be regarded as indicative rather than definitive, and replication with a larger, geographically diverse sample is recommended before practical conclusions are drawn for instrument construction.
5 Conclusion
This study has systematically investigated the Karadeniz kemenche’s structural-acoustic relationships through an integrated approach combining experimental modal analysis, binary classification, and regression modelling. Our findings reveal how the instrument’s design correlates with distinct musical traditions–with bass-oriented samples (ivy/plum wood, 0.31 cm soundboards) exhibiting lower fundamental frequencies, while treble-oriented designs (mulberry, 0.25 cm soundboards) show higher Mode 7 frequencies (867 Hz) associated with greater high-frequency spectral content. Mode 1 (∼60 Hz) serves as a structural indicator of body stiffness but does not directly enhance playing frequencies due to the two-octave gap. The regression models quantify key predictors like fingerboard/nut thickness (13.22% effect), providing luthiers with actionable design parameters.
5.1 Methodological contributions to musical acoustics
Our tripartite analytical framework offers a transferable template for studying diverse musical instruments, particularly folk variants with regional construction differences. The approach successfully addresses three critical challenges in heritage instrument research:
-
handling material anisotropy through dummy-encoded categorical variables,
-
linking vibrational modes to perceptual outcomes (e.g. Mode 7 frequencies correlating with high-frequency spectral content), and
-
balancing small sample sizes with robust statistical validation (Gap statistic = 0.82).
This methodology could readily be applied to study other bowed lutes like the Greek lyra or Persian kamancheh, where similar interactions between body resonances and string harmonics occur.
5.2 Key acoustical insights
The kemenche demonstrates two distinct design approaches: bass-group instruments exhibit lower fundamental frequencies associated with specific material choices (ivy/plum) and thicker soundboards, while treble-group designs show higher Mode 7 frequencies and greater high-frequency radiation through thin soundboards and neck vibrations. These adaptations manifest spectrally as a 28% energy difference above 2 kHz between groups–a finding that aligns with broader principles of string instrument acoustics yet highlights how cultural performance needs correlate with physical design. Modes 2 (mean 227 Hz) and 3 (mean 378 Hz) are potential candidates for coupling with bass fundamentals, while Mode 1 (∼60 Hz) serves primarily as a structural indicator. Of particular note is how transitional samples (e.g. Sample 5) with hybrid characteristics challenge conventional classification systems, suggesting that “imperfect” designs may serve unique musical functions worth further study.
5.3 Future directions
While establishing foundational correlations, this work invites several research extensions:
-
dynamic studies under playing conditions to capture nonlinear interactions,
-
material treatment analyses (e.g. chemical-hardened boxwood fingerboards) to quantify damping effects, and
-
comparative studies of regional variants across different folk instruments.
For acousticians, the kemenche serves as a compelling case study in how musical function drives acoustic optimisation – a principle applicable to both heritage preservation and contemporary instrument design. As the kemenche evolves in diaspora communities, the framework developed here provides tools to maintain its acoustic identity while accommodating new performance contexts.
Acknowledgments
The authors would like to thank Ali Alkın, BS, for his support in the experimental modal analysis framework.
Funding
This study was supported by Scientific and Technological Research Council of Turkiye (TUBITAK) under Grant Number 221M499. The authors thank TUBITAK for their support.
Conflicts of interest
The authors declare no conflict of interest.
Data availability statement
Data are available on request from the authors.
Author contribution statement
Conceptualisation, A.O.; methodology, A.O.; hardware and software A.O.; data collection, A.O., A.A.; data analysis, curation and visualisation, A.O., A.K.; writing – original draft, A.O.; writing – review and editing, A.O.; funding acquisition, A.O. All authors have read and agreed to the published version of the manuscript.
Ethical approval
Statement concerning the originality of the work. The authors declare that the work is original.
References
- Saygun: Rize, Artvin ve Kars Havalisi Türkü, Saz ve Oyunları Hakkında Bazı Malumat. Nümune Matbaası, İstanbul, 1937. [Google Scholar]
- S. Cihanoğlu: Doğu Karadeniz Bölgesinde Oynanan Horonlar, Karşılamalar, Barlar ve Halaylar. Trabzon Valiliği İl Kültür ve Turizm Müdürlüğü Yayınları, Trabzon, 2004. [Google Scholar]
- S. Şenel: Trabzon Bölgesi Halk Musikisine Giriş. Anadolu Sanat Yayınları, İstanbul, 1994. [Google Scholar]
- M. Duman: Kemençemin Telleri. Trabzon Araştırmaları Merkezi Vakfı, İstanbul, 2004. [Google Scholar]
- M.R. Gazimihal: Şarki Anadolu türküleri ve oyunları. Evkaf Matbaası, İstanbul, 1929. [Google Scholar]
- H. Günay: Görele’de Kemençe ve Kemençeciler. Giresun Kültür Sempozyumu Bildirileri, Giresun, 1998. [Google Scholar]
- L. Picken: Folk Musical Instruments of Turkey. Oxford University Press, London, 1975. [Google Scholar]
- K. Reinhard: Musik am Schwarzen Meer. Jahrbuch für musikalische Volks-und Völkerkünde 2 (1966) 1–45. [Google Scholar]
- A. Alkın, A. Oktav: Variation of the acoustic response of Karadeniz kemenche due to the size and geometry of the sound holes. Applied Acoustics 226 (2024) 110212. [Google Scholar]
- K.L. Signell, B. Nettl: Makam: Modal Practice in Turkish Art Music. Asian Music Publications, Seattle, Wash., 1977. [Google Scholar]
- N.H. Fletcher, T.D. Rossing: The Physics of Musical Instruments. Springer Science & Business Media, 2012. [Google Scholar]
- D.J. Ewins: Modal Testing: Theory, Practice and Application. John Wiley & Sons, 2009. [Google Scholar]
- W. Heylen, S. Lammens, P. Sas: Modal Analysis Theory and Testing. Katholieke Universiteit Leuven, 1998. [Google Scholar]
- R. Bader: Computational Mechanics of the Classical Guitar. Springer, Berlin, Heidelberg, 2005. [Google Scholar]
- M. Pastor, M. Binda, T. Harčarik: Modal assurance criterion. Procedia Engineering 48 (2012) 543–548. [CrossRef] [Google Scholar]
- R.J. Allemang, D.L. Brown: A complete review of the complex mode indicator function (CMIF) with applications, in: Proceedings Of Isma International Conference On Noise And Vibration Engineering, 2006, pp. 3209-3246. [Google Scholar]
- M. Quintavalla, F. Gabrielli, C. Canevari: Grading materials for stringed instruments soundboards. Applied Acoustics 187 (2022) 108521. [Google Scholar]
- M. Spycher, F.W. Schwarze, R. Steiger: Assessment of resonance wood quality by comparing its physical and histological properties. Wood Science and Technology 42, 4 (2008) 325–342. [CrossRef] [Google Scholar]
- L. Kaufman, P.J. Rousseeuw: Finding Groups in Data: an Introduction to Cluster Analysis. John Wiley & Sons, 2009. [Google Scholar]
- R. Tibshirani, G. Walther, T. Hastie: Estimating the number of clusters in a data set via the gap statistic. Journal of the Royal Statistical Society: Series B (Statistical Methodology) 63, 2 (2001) 411–423. [Google Scholar]
- J. Woodhouse: The acoustics of the violin: a review. Reports on Progress in Physics 77, 11 (2014) 115901. [CrossRef] [PubMed] [Google Scholar]
- Oktav: The variation in the acoustic response of the Karadeniz kemenche depending on the thickness of the soundboard. Acoustics Australia 53, 1 (2025) 83–97. [Google Scholar]
- D.C. Montgomery, E.A. Peck, G.G. Vining: Introduction to Linear Regression Analysis, 6th edn. Wiley, Hoboken, 2021. [Google Scholar]
- D.B. Suits: Use of dummy variables in regression equations. Journal of the American Statistical Association 52, 280 (1957) 548–551. [Google Scholar]
- D.N. Gujarati, D.C. Porter: Basic Econometrics, 5th edn. McGraw-Hill, New York, 2009. [Google Scholar]
- N.R. Draper, H. Smith: Applied Regression Analysis, 3rd edn. Wiley, New York, 1998. [Google Scholar]
- S.S. Shapiro, M.B. Wilk: An analysis of variance test for normality (complete samples). Biometrika 52, 3-4 (1965) 591–611. [CrossRef] [Google Scholar]
- I.K. Yeo, R.A. Johnson: A new family of power transformations to improve normality or symmetry. Biometrika 87, 4 (2000) 954–959. [CrossRef] [Google Scholar]
- J.W. Tukey: On the comparative anatomy of transformations. The Annals of Mathematical Statistics 28, 3 (1957) 602–632. [Google Scholar]
- M.J. Anderson: Permutation tests for univariate or multivariate analysis of variance and regression. Canadian Journal of Fisheries and Aquatic Sciences 58, 3 (2001) 626–639. [Google Scholar]
Cite this article as: Oktav A. Kurt A. & Akat A. 2026. Timbral determinants of the Karadeniz kemenche: a multimodal analysis of material and geometric inuences. Acta Acustica, 10, 33. https://doi.org/10.1051/aacus/2026026.
All Tables
Experimental natural frequencies (Hz) of the first 10 vibrational modes for 18 Karadeniz kemenche samples (K01–K18). Values reflect variability due to material anisotropy and manufacturing tolerances.
All Figures
|
Figure 1. The 18 Karadeniz kemenche samples analysed in this study, displaying regional variations in size, body proportions, and construction characteristics representative of Eastern Black Sea craftsmanship traditions (The strings and related components have been disassembled for experimental modal analysis). |
| In the text | |
|
Figure 2. Geometric parameters of Karadeniz kemenche: (1) Base length, (2) Base width, (3) Base thickness, (4) Side length, (5) Side width, (6) Soundpost length, (7) Soundboard length, (8) Soundboard width, (9) Soundboard thickness, (10) Sound hole length, (11) Tailpiece length, (12) String length, (13) Fingerboard length, (14) Fingerboard/Nut thickness, (15) Nut length, (16) Neck length, (17) Upper saddle length, (18) Scroll length, (19) Scroll height, (20) Total length, (a) min., (b) max. |
| In the text | |
|
Figure 3. Experimental modal analysis setup for three representative kemenche samples. (a) Full free-boundary suspension rig: the instrument is suspended by elastic strings attached to microphone stands to minimise external constraints. (b) Side/neck view showing accelerometer placement on a second instrument. (c) Close-up of the soundboard surface with seven single-axis accelerometers. |
| In the text | |
|
Figure 4. Distribution of natural frequencies across vibrational modes for 18 kemenche samples. Boxes span the 25th–75th percentiles, whiskers show full ranges, and horizontal lines mark median values. Modes are ordered 1–10 (left to right). |
| In the text | |
|
Figure 5. Regional variations in pitch frequencies of Karadeniz kemenche samples. Box plots show distributions of (A) bass string open frequencies, (B) treble string open frequencies, and (C) highest fingered pitches, grouped by construction region (Rize: blue, Trabzon: orange, Giresun: red). Boxes span the 25th–75th percentiles with median lines; whiskers extend to 1.5 × IQR; individual points represent samples. Open-string frequencies were measured with a digital tuner (±1 cent) on strings tuned at time of measurement. Structural modal frequency bands (Mode 2: 253 Hz; Modes 3–4: 432–457 Hz; Mode 9: 987 Hz) are overlaid as grey bands to highlight structural-acoustic coupling. Significant regional differences were confirmed by non-parametric Kruskal–Wallis tests (p < 0.01 for all frequency ranges) with effect sizes (η2) reported in the text. |
| In the text | |
|
Figure 6. Comparison of fundamental pitch ranges between bass-oriented (D3-F#4) and treble-oriented (G4-A4) kemenche samples. Bass-group instruments predominantly use ivy/plum (91%), while treble-oriented instruments employ denser woods (100% mulberry/mahogany). Mode 1 frequencies (mean ∼60 Hz) do not differ significantly between groups (p = 0.12) and serve as structural indicators rather than direct enhancement mechanisms. Error bars represent standard deviations. |
| In the text | |
|
Figure 7. Average power spectral density of bass-oriented (blue, n = 11) and treble-oriented (red, n = 7) kemenche samples. Each instrument was played by an experienced performer executing a standardised bowing pattern (open strings, mezzo-forte, 3 repetitions per instrument). Recordings were made with a Neumann TLM 170R cardioid condenser microphone at 50 cm distance, 45° off-axis, in an acoustically treated room (RT60 ≈ 0.3 s at 1 kHz; background noise < 30 dB(A)). Power spectral density was computed using Welch’s method (Hanning window, 50% overlap, 4096-point FFT, 44.1 kHz sampling rate), normalised by total energy (0–5 kHz), and averaged within each group. Shaded bands represent ±1 standard deviation across instruments within each group. The grey shaded region marks the high-frequency analysis band (2–4 kHz). Treble-oriented instruments demonstrate 28.3 ± 6.1% (bootstrap 95% CI) greater high-frequency energy in the 2–4 kHz band. |
| In the text | |
|
Figure 8. Actual versus predicted bass string frequencies (Yeo–Johnson transformed). Predictions show closest alignment for typical bass-group samples (ivy/plum wood, 0.31 mm soundboards; Sect. 3.2), with larger deviations for transitional Sample 5, which combines bass-range tuning with treble-like construction features. |
| In the text | |
|
Figure 9. Actual versus predicted treble string frequencies (Yeo–Johnson transformed, λ = 1.1301). Each point represents one instrument, coded by body material (symbol) and group membership (colour: bass-oriented = blue, treble-oriented = red). The shaded band represents the 95% bootstrap confidence interval around the regression line. Predictions show closest alignment for typical treble-oriented samples (mulberry body, 0.25 mm soundboards; Sect. 3.2), with larger deviations for transitional Sample 16, which combines treble-range materials with bass-like modal properties. Model was validated using leave-one-out prediction. |
| In the text | |
|
Figure 10. Actual versus predicted highest playable pitches (Yeo–Johnson transformed). Predictions show closest alignment for instruments with structural modes avoiding A5 (880 Hz), with energy dissipation observed when pitches approach Mode 9 (987 Hz; Sect. 3.2). Transitional samples exhibit intermediate behaviour. |
| In the text | |
Current usage metrics show cumulative count of Article Views (full-text article views including HTML views, PDF and ePub downloads, according to the available data) and Abstracts Views on Vision4Press platform.
Data correspond to usage on the plateform after 2015. The current usage metrics is available 48-96 hours after online publication and is updated daily on week days.
Initial download of the metrics may take a while.