Figure 10
Download original image
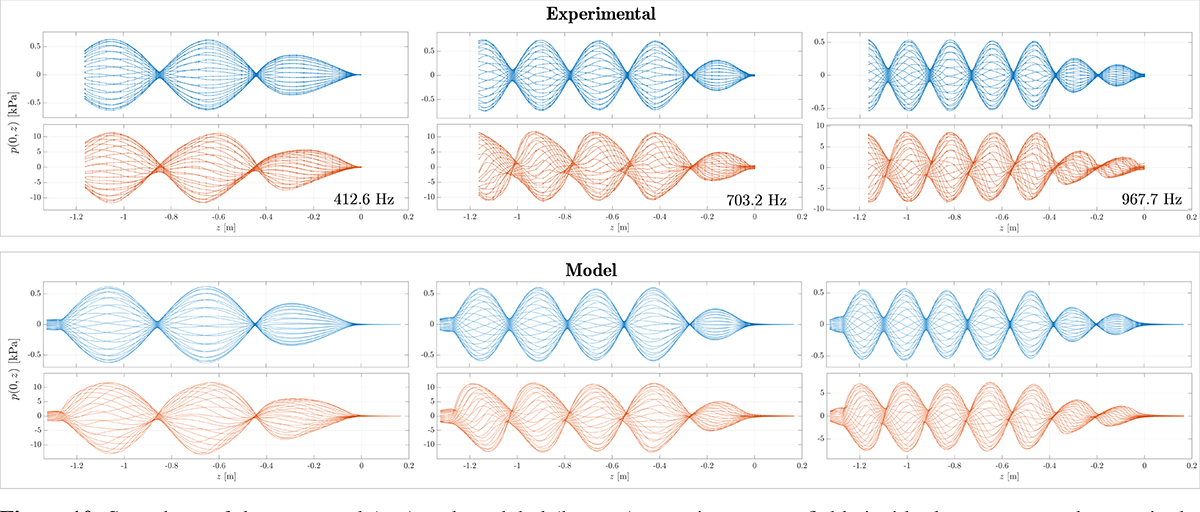
Snapshots of the measured (top) and modeled (bottom) on-axis pressure fields inside the resonator when excited at three modal frequencies at small (blue) and large (red) amplitudes. In the experimental results, dots denote the actual measurements while the connecting lines are a product of interpolation. Model results were calculated via temporal integrations where modal truncation was set to N = 100 and where the geometry was aimed at emulating the experimental configuration, i.e., including a cavity at the entrance (driver’s inherent volume).
Current usage metrics show cumulative count of Article Views (full-text article views including HTML views, PDF and ePub downloads, according to the available data) and Abstracts Views on Vision4Press platform.
Data correspond to usage on the plateform after 2015. The current usage metrics is available 48-96 hours after online publication and is updated daily on week days.
Initial download of the metrics may take a while.