Figure 12
Download original image
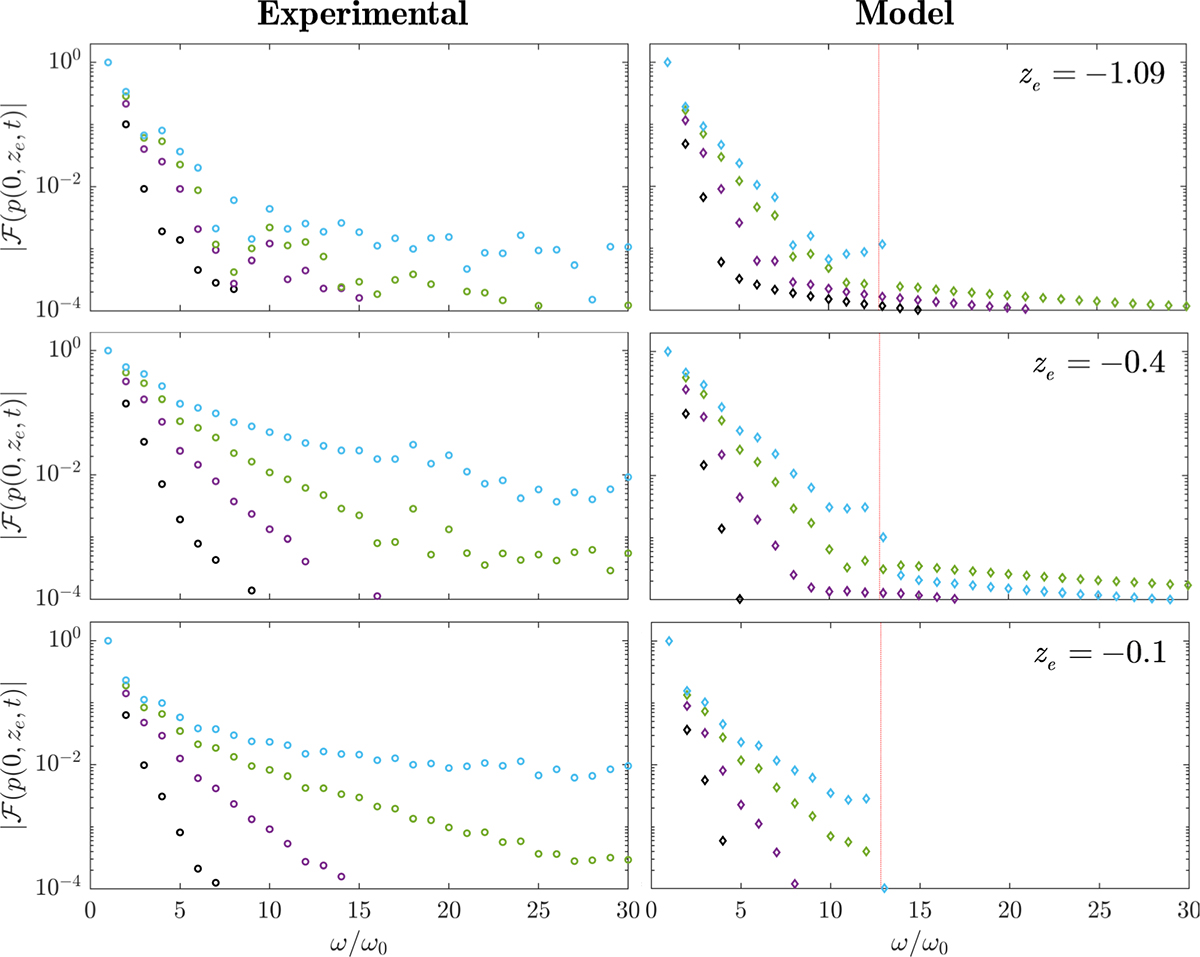
Normalized spectra of the periodic signals shown in Figure 11. Each marker denotes the magnitude of each harmonic component in the periodic signal, normalized by the magnitude of its first component. The red-dotted line denotes the frequency of the highest considered mode ω N . Frequency is here normalized by the forcing frequency ω 0.
Current usage metrics show cumulative count of Article Views (full-text article views including HTML views, PDF and ePub downloads, according to the available data) and Abstracts Views on Vision4Press platform.
Data correspond to usage on the plateform after 2015. The current usage metrics is available 48-96 hours after online publication and is updated daily on week days.
Initial download of the metrics may take a while.